Dashboard Description | About the Data| Definitions | Using the Data| Frequent Questions|Resources
Dashboard Description
This dashboard contains student-level data to provide a warning for students who may be identified in each school’s target group for future school and district report cards. For this dashboard and the related report card priority area, we define a target group as the students in each school in the bottom quartile (25%) of performance based on the prior year’s test results, along with any students who scored less than proficient on that year’s DLM alternate assessment.
What follows are descriptions of the display structure and frequently asked questions about the dashboard information. An “About the Data” section is also below with further details about the target groups and specific definitions for data categories.
*Please note that this dashboard does not display students in your school’s Target Group Outcomes priority area as reflected in your most recent report card. To understand how students are included in the priority area score see the Target Group Outcomes Guide on the Report Card Resources page.
Display Structure
After filtering the dashboard data for the district and school you wish to view, you will see a worksheet of individual student data. Personal information will appear first in the leftmost columns, and in the rightmost columns you will find assessment type, grade, subject, performance category, scale score, and z-score columns.
Most importantly, you will see three highlighted columns with target group probability, the target group probability reason, and the student’s prior test percentile columns. For educators looking for what students are at the highest risk of being in future target groups, you will find the target group probability column the most helpful, as it categorizes students as “High” “Medium” or “Low” probability of future inclusion in the target group. The column for prior test percentile ranking shows the specific percentile of each student (showing lowest to highest by default). This data ultimately feeds into the “target group probability reason” column, meaning students who are in the 30th percentile or below meet the “High” probability threshold of future inclusion in the target group, students above the 30th and at or below the 50th percentile have a medium probability of inclusion, and students above the 50th percentile on the prior assessment have a low probability of inclusion.
The dashboard has default display settings, but you can sort and filter data by test product, grade, etc., in order to make best use of the data for educational improvements.
About the Data
WISEdash can be used to effectively target groups of students most in need of support and improvement. To help schools and districts identify and serve their lowest-performing students, this dashboard shows students who are likely to be in the Target Group Outcomes priority area of school and district report cards in future years. The dashboard does this by facilitating identification of students near the bottom quartile (25%) of performance based on the prior year’s test results, along with any students who scored less than proficient on that year’s DLM alternate assessment.
Note: Unlike almost all other dashboards in WISEdash for Districts, students are listed by the school they are accountable to not the school of attendance. So, although a student may be attending a school outside of your district, if the student is accountable to a school within your district, you will see the student listed under that school.
How the target groups are created in school and district report cards
The target groups ultimately identified in the school and district report cards are determined by prior performance.
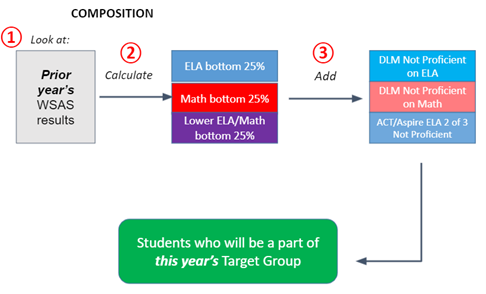
To determine the students who ultimately will be included in a school’s target group, DPI follows the steps below:
- Look at Forward, PreACT Secure (or ACT Aspire prior to 2022-23), and ACT assessment results from the prior year. For example, 2022-23 assessment results will be used to determine which students to include in 2023-24 target groups.
- Convert ELA and mathematics scale scores on state assessments to standardized scores that can be compared across grades (z-scores).
- Percentile rank z-scores within each school to identify the students in the bottom quartile (25%) for assignment to the target group. If the bottom quartile contains fewer than 20 students, keep adding students to the target group until the minimum cell size of 20 is met, up until 50% of students.
- Some students have test results without scale scores from the prior year. These students may still be included in the target group:
- Add students who scored less than proficient on the DLM. The DLM does not provide scale scores, so these students cannot be included in the percentile rankings.
- Add students who only completed 2 out of 3 components of the ELA content area on the ACT (or ACT Aspire prior to 2022-23) assessment, and scored less than proficients. These students also do not have scale scores to be included in the rankings.
For further information about the Target Group Outcomes priority area on the reports cards (including, data components, scoring, weighting, etc.), please see the Target Group Outcomes Guide on the Report Card Resources page
Definitions
-
Target Group: is the students in each school in roughly the bottom quartile (25%) of performance based on the prior year’s test results, along with any students who scored less than proficient on that year’s DLM alternate assessment.
-
Lowest group: in the context of the school and district report cards means the bottom quartile of students based on assessment results unless the bottom quartile comprises fewer than 20 students. In that case, additional students are added to the group until it has 20 members or comprises 50 percent of the ranked students, whichever threshold is reached first.
-
Scale Score: a measure of student performance on a state assessment that takes into account the number and difficulty of test items answered correctly. For example, the scale is applied to all students taking the assessment in a particular subject at a particular grade level. This makes it possible to compare scores between individuals or different groups of students in that grade for a given year or over time.
-
Z-Score: used as a standard score for state assessments and is the number of standard deviations by which the value of a scale score is above or below the mean. Scale scores above the mean have positive z-scores, while those below the mean have negative z-scores.
-
Percentile rank: the percentage of scores in its frequency distribution that are less than that score. Percentile ranking in the context of the target group is based on the z-score described above.
Using the Data
The Target Group Preview Dashboard is designed to help schools identify their lowest performers so they can close their own “gaps” between these students and the rest of the student body. Schools should strive to narrow these gaps by implementing policies and procedures that will best serve the students most in need of support while also improving opportunities for all students. This dashboard explicitly highlights exactly which students need the most support.
Educators and administrators seeking to identify students for educational interventions should pay close attention to students in the “High” probability category since many are likely to be in the next year’s target group (who again, will have their outcomes scored as part of the report card).
The percentile rankings can also help your school target more than just struggling students. For example, educators may find it beneficial to identify specific groupings of students in the “Medium” or “Low” probability categories, or even students below or above a certain percentile in order to focus programming accordingly. The more specific your analysis of your school’s dashboard, the more targeted your support efforts can be for all students.
Frequently Asked Questions
How recent is this data?
The Target Group Preview dashboard is not live, but its data files are updated regularly. See the date of the latest data download in the top left portion of the page (under the Data Filter button). Please note that only one year of data, the current year, displays at a time.
Data for the current school year first becomes available in the weeks following the third Friday in September. It is then updated weekly until the WISEdata Student Snapshot in early December. The dashboard is deactivated at the end of the school year in preparation for loading the following year’s data.
Data loads for this dashboard will typically adhere to the following timeline:
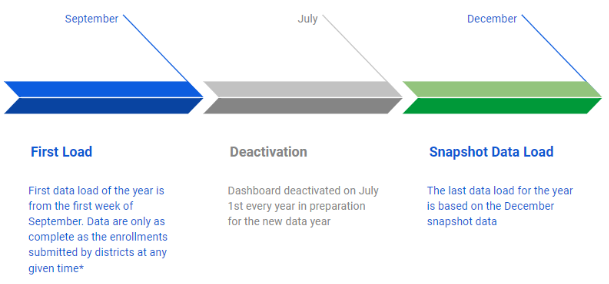
* The more complete the enrollment data flowing to WISEdash the more complete this dashboard will be for the year. We encourage schools and districts to attend to the accuracy and completeness of their data early and often.
Which students are included in the dashboard?
This is a preview dashboard that serves as a warning for students who may be included in the Target Group Outcomes priority area in future report cards based on falling near the bottom quartile for test performance. You will notice a significant number of students at your school are displayed. In short, included in the dashboard are all students in grades 4 through 11 who have been enrolled at your school in the current year from the third Friday of September (TFS) until the most recent data update of the dashboard.
Students without test data from the prior year still appear in the dashboard. These students are not included in the percentiles, however, because they have no test result for the prior year.
Which student-level data are included?
The dashboard only accounts for each student’s performance on the most recent prior state assessment. And as mentioned above, the dashboard includes each student’s prior test scale score, z-score, and test performance category (i.e. Below Basic, Basic, Proficient, and Advanced). See above for definitions of scale score and z-score.
How does ranking work?
All ranking and percentiles are done at the school level, not the grade, or district level. Also, the district dashboard page is a conglomeration of all the school’s target groups combined; students are not ranked district-wide but only within schools.