Monday, November 12, 2018
Contact
Tom McCarthy, DPI Communications Director, (608) 266-3559MADISON — An increasing percentage of public and private schools and public school districts met expectations on report cards issued for the 2017-18 school year compared to the prior year. Overall, 83.7 percent of rated schools meet or exceed expectations as did 96.4 percent of the state’s 422 public school districts.
This is the third year that report cards used legislatively mandated calculations, and the third year that private schools in the Milwaukee, Racine, and statewide parental choice programs received report cards. For 2017-18, 2,114 public schools and 281 private choice schools received report card ratings. Of choice schools, 94 exercised the option to receive both a choice student and an all student report card.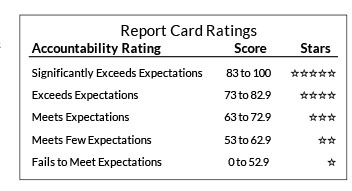
Report card ratings range from five stars, denoting schools and districts that significantly exceed expectations, to one star for those that fail to meet expectations. Scores are calculated in four priority areas: student achievement, school growth, closing gaps between student groups, and measures of postsecondary readiness, which includes graduation and attendance rates, third-grade English language arts achievement, and eighth-grade mathematics achievement.
Scores are reduced for schools and districts that miss student engagement indicator goals of keeping absenteeism below 13 percent and dropout rates below 6 percent. Absenteeism has been an increasing problem across the state, with more schools and districts having deductions than ever before. For 2017-18, three district report cards and 125 school report cards lost five points from the accountability score for missing the absenteeism target.
Report cards provide a snapshot of performance across the four priority areas and can be used to target improvement efforts. To expand the picture of school performance, the Legislature, in 2017 Wisconsin Act 59, directed that additional college and career readiness information be included in report cards. For the current school year, schools and school districts are collecting data on participation in postsecondary coursework (dual enrollment), youth apprenticeship programs, and Advanced Placement coursework as well as acquisition of industry recognized credentials through a school’s technical education program and students’ community service hours.
District Report Cards
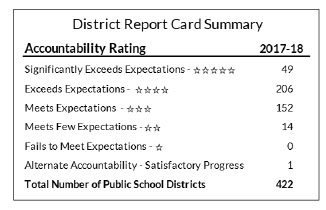 For 2017-18 report cards, no districts failed to meet expectations, the one-star category. One district, the Norris School District in Waukesha County with enrollment of 20 students, achieved satisfactory progress through the alternate accountability process. At the highest accountability level, 49 districts had a five-star rating, which means they significantly exceed expectations. Most districts, 206, achieved four stars, which means they exceed expectations. The three-star, meets expectations, rating was given to 152 districts. Fourteen districts were rated two stars, meets few expectations. Report cards with fluctuations of 10 or more points on the overall score from the prior year carry a ^ notation because the up or down movement is outside expectations for yearly score change. Six district report cards carry the ^ notation.
School Report Cards
At the school level, 327 public and private school report cards earned five stars (significantly exceeds expectations), 768 earned four stars (exceeds expectations), 671 earned three stars (meets expectations) 249 earned two stars (meets few expectations), and 95 earned one star (fails to meet expectations). As with district report cards, the 138 schools with ratings that fluctuated 10 or more points carry the ^ notation. Of the schools receiving report cards through the alternate accountability process, 185 were rated as making satisfactory progress and 19 were rated as needing improvement. Alternate accountability (AA) is a self-evaluation of a school’s performance on raising student achievement in English language arts and mathematics. It is used for new schools, schools without tested grades, schools exclusively serving at-risk students, and schools with fewer than 20 full-time academic year students who took tests. There were 175 schools that were not rated, generally due to insufficient data.
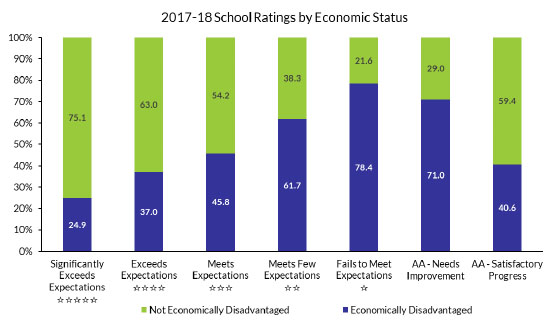
While there are exceptions, schools that have one- and two-star ratings or need improvement through the alternate accountability process have higher rates of student poverty. For the 2017-18 report cards, schools that meet few expectations (two stars) have nearly 62 percent of students from economically disadvantaged families. Schools that fail to meet expectations (one star) have an overall poverty rate of 78.4 percent. Schools that self-identify as needing improvement through alternate accountability have a combined poverty rate of 71 percent. Conversely, schools at the five-star accountability rating, significantly exceeds expectations, have just under 25 percent of students from economically disadvantaged families. The relationship between student poverty and report card ratings remains in spite of the changes that weight growth in the formula to account for this challenge.