Overview
In the 2019 COWS report, Race in the Heartland, Wisconsin was identified as having one of the worst racial disparities across a range of indicators in the United States. Specifically, Wisconsin ranked as 4th worst in the nation for child poverty and infant mortality for black children, 2nd worst for out-of-school suspensions and incarceration for blacks, and the worst in the nation for 8th grade math scores and earned bachelor's degrees for blacks.
Add to that the following data from Wisconsin showing disparities in exclusionary practices for students with IEPs, particularly black and brown students with IEPs. It highlights the need for adults to examine their own biases and beliefs about student behavior, including how bias influences adults’ association or confirmation of specific student populations and their behavior. It also serves as evidence of the need for Wisconsin schools to develop more equitable, culturally competent, and effective practices in supporting students whose behavior interferes with their learning or the learning of others.
The following data analysis was gathered from Wisconsin DPI WISEdash for Districts, Youth Risk Behavior Survey, and Seclusion and Restraint data collection unless otherwise noted.
Likelihood of Disciplinary Removal in Wisconsin for Students with IEPs
- Black or African American students are approximately 6.7 times more likely to experience a disciplinary removal than white students.
- Native American students are 2.9 times more likely to experience a disciplinary removal than white students.
- Hispanic students are 1.9 times more likely to experience a disciplinary removal than white students.
Length of Disciplinary Removal in Wisconsin for Students with IEPs
- Black or African American students are removed for 2.47 days on average per incident.
- Hispanic students are removed for 2.29 day on average per incident.
- Native American students are removed for 1.95 day on average per incident.
- White students are removed for 1.92 day on average per incident.
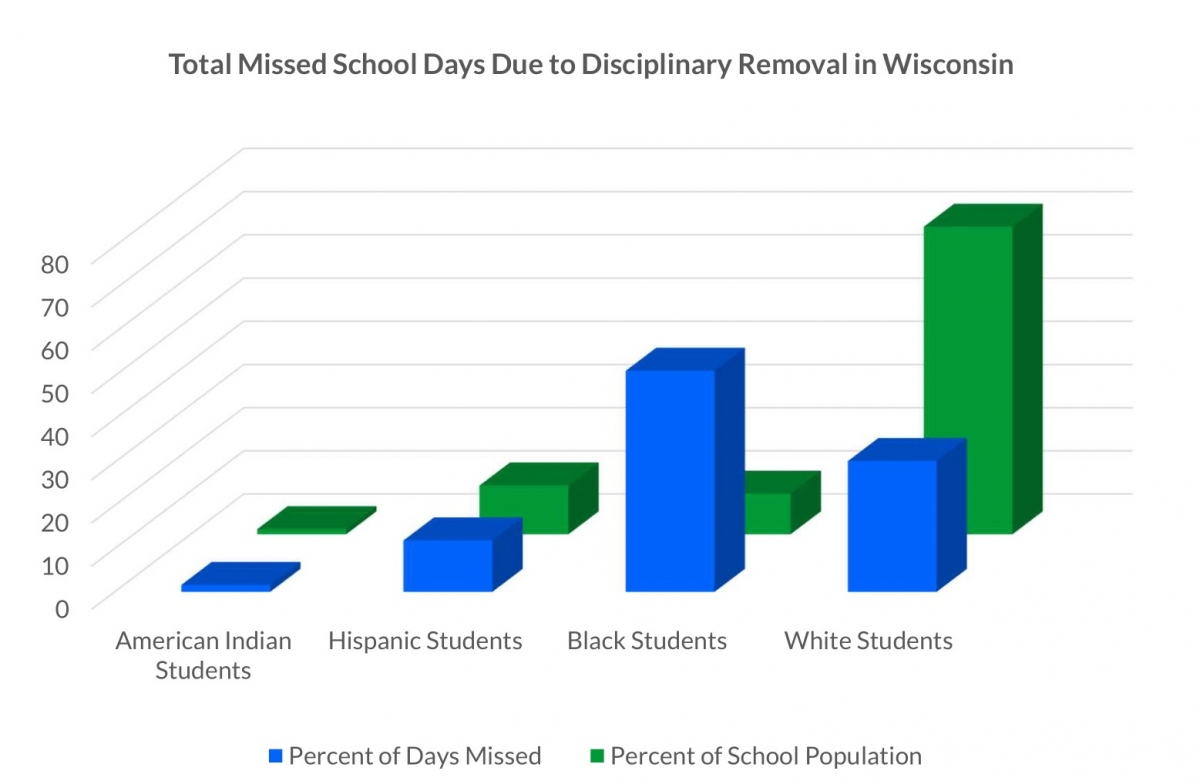
Total Missed School Days Due to Disciplinary Removal in Wisconsin
- During the 2015-16 school year, Wisconsin students missed an estimated 135,916 school days due to out-of-school suspensions.
- White students made up 71.2 percent of the student population (CRDC 2015) and made up 30.3 percent or 41,183 total missed days.
- Black or African American students made up 9.4 percent of the total student population (CRDC 2015) and made up 51.2 percent of missed school days or 69,588 total days.
- Hispanic or Latino students made up 11.3 percent of the student population (CRDC 2015) and 11.9 percent or 16,163 total missed days.
- American Indian or Alaska Native made up 1.2 percent of the total student population (CRDC 2015) and made up 1.6 percent of those days or 2,158 total days.
Early Learning Disciplinary Removals for Students with IEPs
- During the 2018-2019 school year, Wisconsin students in kindergarten through 2nd grade were removed for approximately 7,711 school days due to an out-of-school suspension.
- During the 2018-2019 school year, in Wisconsin, 19 students in K3 and K4 were removed for approximately 49 days due to an out-of-school suspension.
- During the 2018-2019 school year, of the total K3 and K4 population enrolled, 0.9% of black students received a disciplinary removal (1276 black students enrolled, 11 students received a disciplinary removal) and 0.2% of white students received a disciplinary removal (4856 white students enrolled, 11 students received a disciplinary removal).
Seclusion and Physical Restraint in Wisconsin Schools
- Nearly half of all Wisconsin schools (1,180 schools) reported at least one incident where either seclusion or physical restraint was used on a student during the 2019-20 school year.
- Statewide, schools reported a total of 8,733 instances of seclusion and 9,795 instances where physical restraint was used.
- Students with disabilities comprised 82 percent of all seclusion incidents, and 77 percent of all physical restraint incidents.
Predictive Factors of Disciplinary Removal
- The long term, negative impact of disciplinary removal is great. Even one instance of suspension from school is predictive of future suspension and a greater likelihood of dropping out of school (American Psychology Association Zero-Tolerance Task Force 2006; Balfanz, Byrnes, and Fox 2014; America’s Promise Alliance 2018).
- In the 2017-18 school year, students ages 14-21 identified with emotional disturbance were more likely to drop out and less likely to graduate than all students with disabilities (Skiba et al. 2011).They are also more likely to isolate themselves by exhibiting behavior that interferes with learning or withdrawing from social interaction entirely.
- Students impacted by trauma are suspended and expelled at higher rates than other students (Shonk & Cicchetti 2001; America’s Promise Alliance, 2018).
- Research from Skiba et al. indicates that similarly situated students got treated differently based on race. Students from “African American families are 2.19 times (elementary) to 3.78 (middle) times as likely to be referred to the office for problem behavior as their White peers.” In addition, the results indicate that students from African American and Latino families are more likely than their White peers to receive expulsion or out-of-school suspension as consequences for the same or similar problem behavior (Skiba et al. 2011). Findings also suggest that the types of referrals at the middle school level for African American students are more subjective, such as defiance and disrespect.
Disciplinary Removal and Belonging
If students don’t feel they belong, they have little motivation to engage within that school or classroom community. Research demonstrates a link between having a sense of connection to the school and fewer emotional and behavioral problems.
Only 61.1 percent of high school students in Wisconsin reported a sense of belonging at their school.
Foster et al. found that “youth who reported feeling connected to their schools reported fewer depressive symptoms, and less suicidal ideation, social anxiety, and sexual activity. These youth also reported higher levels of self-esteem and more adaptive uses of free time” (Foster et al. 2017).
There is extensive research that school climate has a profound impact on a wide range of emotional and mental health outcomes (Kuperminic et al. 1997; Payton et al. 2008; Shochet et al. 2006; Way, Reddy, and Rhodes 2007).
Summary
Despite research that shows exclusionary practices can have long term negative effects for students, can actually cause harm, and do little or nothing to change a behavior that interferes with learning, schools in Wisconsin continue this practice. The findings above highlight a sense of urgency and point to the need to better support students with equitable, culturally competent, and effective practices for all students, and particularly for black students. Providing such support will strengthen students' sense of connection to school and promote their access, engagement, and progress in their education. Adults sometimes fail to understand that the lack of connection to school is particularly true for students who are not equitably served or students identified with an emotional behavioral disability. It is imperative, particularly for these students, that adults work diligently to ensure they feel a sense of belonging in our classrooms.
Reflection and Application Activities
The following reflection and application activities were developed to build the knowledge, skills, and systems of adults so they can assist students with accessing, engaging, and making progress in age or grade level curriculum, instruction, environments, and activities.
-
Review the data in this document. What data or information had the greatest effect on you? Why? How will this change how you support students with significant behavioral needs?
-
Review your district’s data disaggregated by race, discipline, and disability category in your district’s WISEDash for Districts portal (if you do not have access, you can view public information in the WISEdash Public portal). What race-based patterns of identification or discipline do you see in your school district?
-
When looking across all of the disability categories, what are the disability categories where you notice and do not notice disproportionate identification? Why do you think there are race-based patterns for some disability categories and not others?
-
What other ways can you disaggregate data where you see differences in rates of identification for various disability categories (e.g., gender)? What may be some of the reasons for these differences?
-
-
What adult or system factors contribute to race-based patterns of discipline or race-based patterns of identification within a disability category?
-
Discuss with your team how to use the data in this document or data from your own school district to support system changes efforts in your school or district. Who should this data be shared with? How should it be shared?
-
Discuss the purpose of suspensions and how they are currently used in your district or school.
-
What is achieved from three days of suspension that can’t be achieved by one?
-
What is the process following a suspension? Are students provided a supportive process as they return to school?
-
-
Discuss with your team how they have seen disciplinary removals impact outcomes for students with significant behavioral needs.
-
What other actions, besides discipline, might better support these students?
-
-
Look at the section relating to total missed school days due to disciplinary removals. What are the short-term and long-term effects of missed instructional time due to out-of-school suspension for students?
Review the module Using Data to Decrease Physical Restraint and Seclusion. What can your school or district do to reduce the use of physical restraint and seclusion?
References
- America’s Promise Alliance. 2018. “The Link Between Suspensions, Expulsions, and Dropout Rates.” Accessed March 12, 2021.
- American Psychological Association. 2006. “APA Zero Tolerance Task Force Report.” Accessed March 12, 2021.
- Balfanz, Robert, Vaughan Byrnes, and Joanna Fox. 2014. "Sent Home and Put Off-Track: The Antecedents, Disproportionalities, and Consequences of Being Suspended in the Ninth Grade." Journal of Applied Research on Children: Informing Policy for Children at Risk 5, no. 2, article 13.
- Civil Rights Data Collection (CRDC). “2015-16 State and National Estimations.” U.S. Department of Education. Accessed March 11, 2021.
- Dresser, Laura. 2019. “Race in the Heartland: Wisconsin’s Extreme Racial Disparity.” COWS.
- Foster, Cynthia Ewell, Adam Horwitz, Alvin Thomas, Kiel Opperman, Polly Gipson, Amanda Burnside, Deborah M. Stone, and Cheryl King. 2017. “Connectedness to family, school, peers, and community in socially vulnerable adolescents.” Child and Youth Services Review 81 (Oct): 321–331.
- Kuperminic, Gabriel, Bonnie Leadbeater, and Sidney Blatt. 2001. “School Social Climate and Individual Differences in Vulnerability to Psychopathology among Middle School Students.” Journal of School Psychology 39, no. 2: 141-159.
- Payton, John, Roger P. Weissberg, Joseph A. Durlak, Allison B. Dymnicki, Rebecca D. Taylor, Kriston B. Schellinger, and Molly Pachan. 2008. “The Positive Impact of Social and Emotional Learning for Kindergarten to Eighth-Grade Students.” Accessed March 12, 2021.
- Shochet, Ian, Mark R. Dadds, David Ham, and Roslyn Montague. 2006. “School Connectedness Is an Underemphasized Parameter in Adolescent Mental Health: Results of a Community Prediction Study.” Journal of Clinical Child & Adolescent Psychology 35, no. 2: 170-179.
- Shonk, Susan, and Dante Cicchetti. 2001. “Maltreatment, competency deficits, and risk for academic and behavioral maladjustment.” Developmental Psychology 37, no. 1: 3–17.
- Skiba, Russell J., Robert H. Horner, Choong-Geun Chung, M. Karega Rausch, Seth L. May, and Tary Tobin. 2011. “Race Is Not Neutral: A National Investigation of African American and Latino Disproportionality in School Discipline.” School Psychology Review 40, no. 1: 85–107
- Thapa, Amrit, Jonathan Cohen, Ann Higgins-D’Alessandro, and Shawn Guffey. 2012. “School Climate Research Summary: August 2012.” National School Climate Center, no. 3: 1-21.
- U.S. Department of Education. “IDEA Part B Exiting Collection: 2017-18.” Accessed March 11, 2021.
- Way, Niobe, Ranjini Reddy, and Jean Rhodes. 2008. “Students’ Perceptions of School Climate During the Middle School Years: Associations with Trajectories of Psychological and Behavioral Adjustment.” American Journal of Community Psychology 40: 194-213. Accessed March 12, 2021.
- Wisconsin Department of Public Instruction. “2019 Disciplinary Data by Race and Disability.” WISEdash for Districts 2020.
- Wisconsin Department of Public Instruction. “2019 Disciplinary Data Days Removed by Type and Grade Level.” WISEdash for Districts 2020.
- Wisconsin Department of Public Instruction. “DPI publishes newly available data on seclusion and restraint in schools.” Last modified January 19, 2021.
- Wisconsin Department of Public Instruction. “Summary Report: 2019 Wisconsin Youth Risk Behavior Survey.” Last modified March 2020.
- Wisconsin Department of Public Instruction. “WISEdash Public Portal.” Accessed March 11, 2021.