WISEdash for Districts: Snapshot Dashboards - Year End Completion
About the Data | Definitions of Crosstab Filters | FAQ | Resource Links
About the Data
The Year End (YE) completion data presented on WISEdash reveals key performance indicators that serve as a ‘year in review’ for important completion data. The seven indicators on this dashboard also give you a quick glance at your overall data for the selected district or school and also point out possible issues with your data that you should investigate further. Drill into the indicators to see the students or details that make up the count or rate in the indicator.
The Year End Completion Snapshot Dashboard includes the following Data Quality Indicators based on the current view of the data.
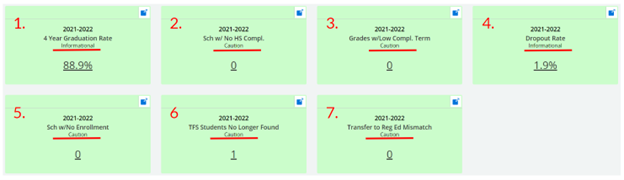
1. 4 Year High School Graduation Rate
This indicator displays the four-year Adjusted Cohort High School Graduation Rate for the indicated school year. The Data Quality Indicator does not apply the Grad Cohort filter, so it will always show the four-year rate. None of the student-level filters above are applied. Results appear as a percentage. Filter the student list by the column Completion Status as a way to see which students are included in the percentage as completed/graduates.
2. Schools with No High School Completion
This indicator displays the number of schools that offer grade 12 that do not have any high school completers reported. A value of zero may be correct, but you should drill in to the Data Quality Indicator to see which schools they are, and verify there are indeed no completers at those schools. None of the student-level or cohort filters above are applied.
3. Grades with Low Completed Term
This indicator displays the number of school and grade level combinations that have a percentage of students with a Completed School Term flag set to Yes that is less than 75%. Correctly reporting students as having completed the school term means that your dropout rates will be lower. None of the student-level or cohort filters above are applied.
4. Dropout Rate
This indicator displays the Dropout Rate for your school if the school offers grades 7-12. When you click this percentage, it will show you a table of students in grades 7-12 who have the potential to be dropouts - not actual dropouts. The column header "Dropout Indicator" can be used a s a filter by clicking the three horizontal lines, and typing in 'Yes'. This will reveal a table of all students who are actual dropouts. Dropouts can be either full-term dropouts that missed an entire school year or mid-term dropouts that dropped out during the school year. In both cases, the students did not return by the Third Friday of September following the end of the school year. None of the student-level demographics filters above are applied. Results appear as a percentage. Filter the student list by the column Completion Status as a way to see which students are included in the percentage as completed/graduates. This same information can be viewed on the Dropout Crosstabs.
5. Schools with No Enrollments
This indicator displays the number of schools that have not reported any enrollment for the entire year. This may be correct, but you should click the Data Quality Indicator to see which schools they are and verify there are no students at those schools. None of the student-level or cohort filters above are applied.
6. TFS Students No Longer Found
This indicator displays the number of students that were enrolled according to the TFS snapshot but no enrollment record of the student is currently found in any public school district.
7. Transfer to RegEd Mismatch
This indicator displays the number of students who for federal reporting purposes are included in the federal exiting reporting category of Transferred to Regular Education but do not have a Reason Exited Special Education of Transferred to Regular Education or Revoked Consent for Special Education Services. For these students, the sSEPA record has an end date prior to the student’s enrollment end date. Both the sSEPA end date and Reason Exited Special Education for these students should be reviewed for accuracy.
Definitions of Applicable Crosstab Data Filters
Four Different Dynamic Crosstabs Available for Year End Completion Dashboard
The Year End Completion dashboard is unique in that there are four separate dynamic crosstabs available for users.
Keep scrolling down on WISEdash to view the following dashboards:
(Current view and Snapshot view)
(Current view and Snapshot view)
Dropout Crosstab (same info as DQI 'Dropout Rate')
(Current view and Snapshot view)
SwD Ages 14-21 Exiting Special Education
(Current view and Snapshot view)
The most commonly occurring filters are defined in detail on the WISEdash for Districts Snapshot Dashboard page. These include:
-
Acctbl Sch/ool
-
Att Sch/ool Name
-
Disability
-
EL/status
-
ELP Code
-
Gender
-
Grade
-
Homeless
-
Race
-
SPED
Exit and Retention Crosstab
In addition to the most commonly occurring crosstab filters, ‘available data’ filters that specifically apply to the Year End Completion - Exit and Retention Crosstab dashboard are:
-
Comp Sch Term / Completed Term - {Completed School Term} - A yes/no indicator identifies whether or not a student completed the most recent school term (year). 'Yes' would typically be expected only in the most recent enrollment record for the school term. A student should be marked Yes, Completed School Term, so long as the student completes all the required course and school requirements. Even if a student leaves early for a summer trip or graduates early, if the student met all the requirements, mark that the student completed the school term.
- Visit the Completed School term data element page for more information.
-
Econ - Economically disadvantaged or non-economically disadvantaged status is determined by many indicators. Economically disadvantaged status is reported separately from a student’s food services eligibility.
-
Exit Type / Enroll Exit Type - A multi-letter code (i.e. HSC) representing an Exit Description and describing the circumstances under which the student exited from a school. Exit type is required any time there is an exit date.
-
Exit Desc / Enroll Exit Desc - {Exit Description} - A short explanatory narrative describing each Exit Type (i.e., HSC → High School Completion).
-
Visit the Exit Types data element page for more information.
-
-
Pri Night Res - {Homeless Primary Nighttime Residence type} - A code entry indicator describing the type of impermanent housing, or lack of housing, where a homeless student stays the night.
-
Pri Night Res codes
-
S - Shelter and Transitional Housing
-
D - Doubled Up
-
H - Hotel/Motel
-
U - Unsheltered
-
-
Visit the Homeless Primary Nighttime Residence type data element page.
-
-
Repeat Grade Indicator - A yes/no indicator indicating whether or not a student has completed a grade (‘no’ - i.e., no, the student does not need to repeat the grade) or needs to repeat the previous year’s grade (‘yes’ - i.e., yes, the student does need to repeat the previous year’s grade) .
- Visit the Repeat Grade Indicator data element page for more information.
-
SpEd EDFacts Federal Exiting Category - A checkbox indicator, similar to Exit Reason, using indicators as determined by EdFacts. This data element annotates in more detail how a special education completed high school from the reporting agency.
-
SpEd EdFacts Federal Exiting Categories
-
Died
-
Dropped out
-
Graduated with regular high school diploma
-
Moved, known to be continuing
-
Transferred to regular education
-
-
Refer to the EDFacts FS009 - Children with Disabilities (IDEA) Exiting Special Education File Specifications Word document for more information.
-
This will open as a download, not as a browser tab.
-
-
-
SpEd Exit Reason / Reason Exit Special Ed - A code entry indicator describing why a student’s special education record (sSEPA) has an end date.
-
SpEd Exit Reason codes
-
Continuing in Special Education
-
Exited District Due To Enrollment Exit Code
-
Revoked Consent for Special Education Services
-
Transferred to Regular Education Services
-
-
Visit the Reason Exited Special Education data element page for more information.
-
-
Unaccomp Youth - A yes/no/unknown/NA indicator indicating whether or not a homeless student is in the custody of a parent or legal guardian. In WISEdata, this is a true/false indicator. When viewed on WISEdash, Yes = True and No = False. Unknown would display if WISEdash had a problem matching to WISEdata or some other data related error, such as a critical WISEdata Portal error preventing the info from going to WISEdash. NA would display if a school/district indicated homeless status, but didn't submit the Unaccompanied value to WISEdata.
-
Visit the Homeless Unaccompanied Youth data element page.
-
HS Completion for Grad Cohort (4 Years or Less) Crosstab
In addition to the most commonly occurring crosstab filters, ‘available data’ filters that specifically apply to the Year End Completion - HS Completion for Grad Cohort Crosstab dashboard are:
-
Completion Status - A checkbox indicator indicating how/if a student has completed high school:
-
Completed - Regular High School Diploma
-
Not Completed - Continuing Towards Completion
-
Not Completed - Not Known to be Continuing Towards Completion
-
-
Econ - Economically disadvantaged or non-economically disadvantaged status is determined by many indicators. Economically disadvantaged status is reported separately from a student’s food services eligibility.
-
Visit the Economically Disadvantaged Status data element page for more information.
-
-
HS Completion Year - This filter allows you to select the year of the graduating cohort. Presented as a YYYY-YY format, for example: 2021-22.
Dropout Crosstab
Of the most commonly occurring crosstab filters, the Dropout Crosstab only lists Disability, EL, Gender, Homeless, Race and SPED . Other ‘available data’ filters that specifically apply to the Year End Completion - Dropout Crosstab dashboard are:
- Completed Term - A yes/no indicator describing whether or not the student/s competed the full school term.
- Dropout Type - A checkbox indicator describing when/if a student has dropped out:
-
Not dropout
-
Full Term (dropout)
-
Mid Term (dropout)
-
- Econ - Economically disadvantaged or non-economically disadvantaged status is determined by many indicators. Economically disadvantaged status is reported separately from a student’s food services eligibility.
- Visit the Economically Disadvantaged Status data element page for more information.
SwD Ages 14-21 Exiting Special Education Crosstab
In addition to some of the most commonly occurring crosstab filters, ‘available data’ filters that specifically apply to the Year End Completion - SwD Ages 14-21 Exiting Special Education Crosstab dashboard are:
-
Age at Child Count - A numerical indicator denoting the age of the student on the October 1 Child Count date of the school year data being viewed.
-
Diploma Type - A checkbox indicator annotating whether a special education student earned a regular high school diploma or not.
-
Visit the Credential Type data element page for more information.
-
-
Enroll Exit Type/ Description - a code/phrase indicator describing the nature of a student’s exit from school:
-
BCA - Below Compulsory Age
-
CE - Compassion Exit
-
DE - Death
-
ETC - Expected transfer/promotion to a new school covered by WISEdata
-
HSC - High School Completion
-
INM- International Move
-
ISM - Interstate move
-
MA - Reached Maximum Age for Services
-
ODO - Other, Dropout, or Possible Dropout
-
TC - Transfer to Another WI School Covered by WISEdata
-
TNC - Transfer to a WI School Not Covered by WISEdata
-
TOS - Transfer Out-of-State
-
Visit the Exit Types data element page for more information.
-
-
Federal Reporting Exit Category - a descriptor indicator, annotating a special education student’s exit category.
-
Dropped out
-
Graduated with Regular High School Diploma
-
Moved, known to be continuing
-
Transferred to regular education
-
-
Reason Exit Special Ed - A code entry indicator describing why a student’s special education record (sSEPA) has an end date.
-
SpEd Exit Reason codes
-
Continuing in Special Education
-
Exited District Due To Enrollment Exit Code
-
Revoked Consent for Special Education Services
-
Transferred to Regular Education Services
-
-
Visit the Reason Exited Special Education data element page for more information.
-
Dynamic Crosstabs Tips:
- There is only one available measure for this chart (Count of Students). Refer to the Using the Dynamic Crosstab User Guide for more information.
Frequently Asked Questions about Snapshot Year End Completion Data
- What do the Exit and Retention dashboard show? All counts shown in the Exit and Retention dashboard are for student records reported as enrolled in the selected district/school during the selected school year as of their latest or last enrollment for that year. All counts shown in the HS Completion dashboard are for students in the selected grad cohort identified to be included in the selected year of reporting, whether or not they have actually completed HS. The demographic values are those currently assigned to the student (or assigned at the time of the snapshot).
- Why are SwD ages 14-21 data displayed? The SwD Ages 14-21 Exiting Special Education chart is used for federal reporting purposes to the U.S. Department of Education, Office of Special Education Programs. All counts shown are for students with disabilities ages 14 through 21 who were in special education on July 1, the start of the reporting period, and were not in special education on June 30, the end of the reporting period. A student’s age is determined as of the most recent October 1 Child Count prior to the student exiting special education. The Federal Reporting Exit Category is determined by using the Reason Exited Special Ed and Enroll Exit Type/Desc data reported for a student. The APR Exit Inclusion indicator can be used to identify those students included in calculating Indicator 1 (exiting with a regular high school diploma) and Indicator 2 (exiting as a dropout) for the Annual Performance Report (APR).
- Are there any other dashboards on WISEdash that could give me more information about Year End data? Yes! The following Topic dashboards may come in handy:
- High School Completion Rates dashboard: View 4-, 5-, 6- and 7-year rates to view trends over time. Locate this dashboard under Topics > Graduation > HS Completion > High School Completion Rates.
- View HS Completion Rate Cohorts - especially future cohorts - to review grade level placement accuracy.
- Dropout Rate by Subgroup: Verify the ‘Dropout Rate by [Demographic] and Year [Selected Schools]’ metric for anomalies. Also compare to Statewide Rate (the following metric).Locate this dashboard under Topics > Main > Attendance-Dropouts > Dropout Rate by Subgroup.
- Attendance Rate by Subgroup: Verify the last metric - ‘Attendance Rate by Year and [Demographic] [Selected Schools]’’ metric for anomalies for all students or by the demographic selected in the Group By. Locate this dashboard under Topics > Main > Attendance-Dropouts > Attendance Rate by Subgroup.
- High School Completion Rates dashboard: View 4-, 5-, 6- and 7-year rates to view trends over time. Locate this dashboard under Topics > Graduation > HS Completion > High School Completion Rates.
-
Will a student who transferred out continue to show in the WISEdash dashboard?
Whether or not a student shows in the dashboard depends on where the student went after leaving your district. If the student transferred to another reporting agency, such as another public district, all reporting accountability follows to the new agency. If the student transferred out of state, homeschool, or to a non-choice private school, your district is still accountable for the student's data as the last reporting agency in WISE for the current school year.
Resource Links