WISEdash for Districts: Snapshot Dashboards
About the Data | Definitions of Crosstab Filters | FAQ | Resource Links
About the Data
The snapshot dashboards have primarily been created to assist LEAs with reconciling data prior to an annual snapshot date.
WISEdash is the source from which snapshot data is taken. WISEdash obtains updated nightly, when WISEdata portal pushed data into WISEdash. If you data is not looking accurate on WISEdash, it could be an indicator that your information is not pushing: (a.) from your Student Information System (SIS) to WISEdata, (b.) from WISEdata to WISEdash. Open a Help Ticket if you your school/districts is experiencing problems with proper data flow.
These dashboards can be located by clicking the dashboard icon in the top left side of the page, just under the WISEdash logo. When you click it, a drop down menu appears. Select ‘Snapshots’ to view the snapshot dashboards. NOTE: If you do not see the banner of menus across the top of the screen, there will be an icon in the upper right hand corner that provides a drop-down menu. This occurs when your screen size is too enlarged.
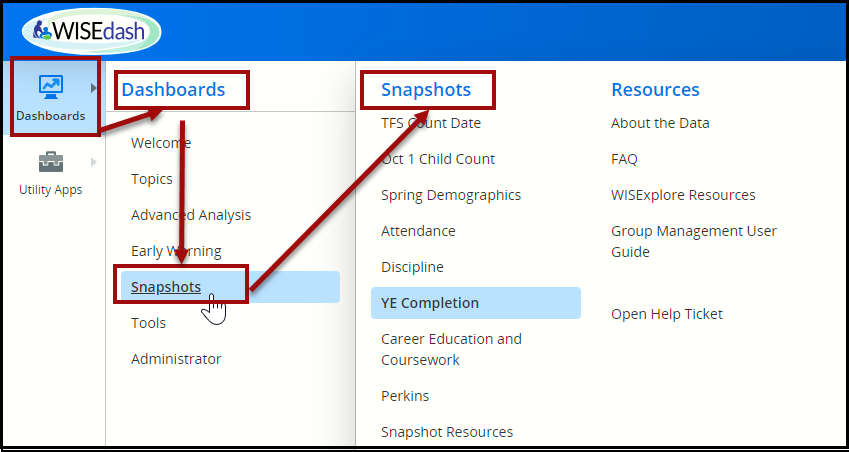
There are eight distinct snapshot dashboards: (listed below in alphabetical order)
Attendance - Career Ed And Coursework - Discipline - October 1 Child Count - Perkins - Third Friday of September - Spring Demographics - Year End (YE) Completion
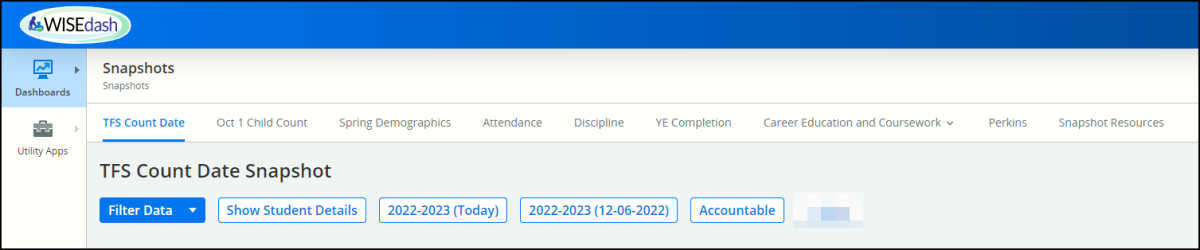
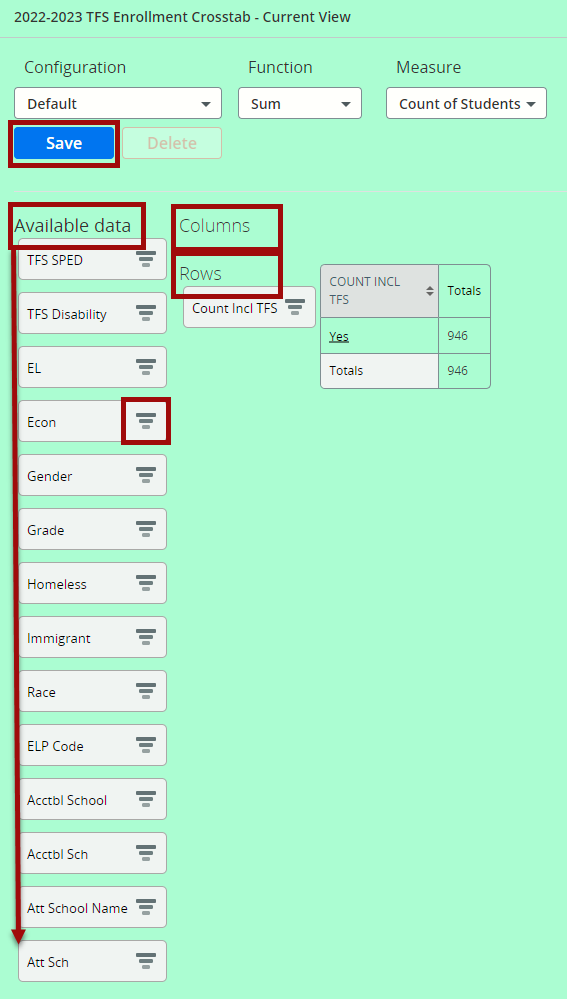
The TFS snapshot dashboard is the default snapshot dashboard. From here, click the blue ‘Filter Data’ button to obtain various filters. All selected filters will display horizontally under the dashboard title as 'tiles.'
Data Quality Indicators
Specialized counts called Data Quality Indicators (DQI) are provided at the top of most snapshot dashboards. These focus on aspects of current data relevant to that snapshot and potential data quality issues that should be investigated prior to the snapshot. Additional information regarding content and usage of the snapshot dashboards are included directly on each dashboard. Click on the blue links to expand the help text.
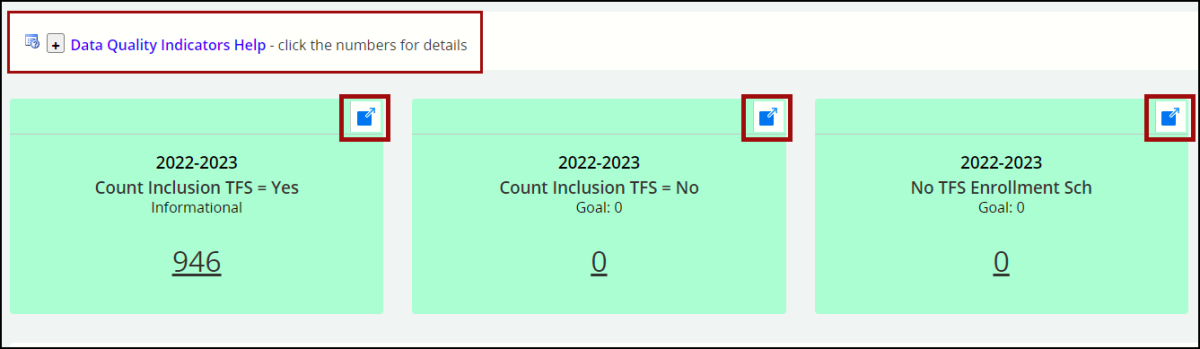
There are three types of Data Quality Indicators.
- Informational indicators give you an easy way to see important counts or percentages for the topic at hand. For example, Count Inclusion TFS = Yes is an informational indicator.
- Caution indicators show you data that may be in error or may be questionable but may also be valid. Review the data more closely to see if it is correct.
- Goal: 0 indicators are similar to cautions, but suggest a goal such as a school count. Goal ‘zero’ indicators show you data where, in most scenarios, the count should be zero. If it is not zero, there is likely to be an error or the data may be questionable. You should review the data more closely to ensure it is correct.
NOTE: Any item on WISEdash that is underlined is interactive - click it to see a more detailed explanation of the data, down to the student level.
Dynamic Crosstabs
On each of the snapshot dashboards, users can change the way data is viewed. Dynamic Crosstabs display data in a table format that users can change. The dynamic aspect of the Dynamic Crosstabs is found in the filters. Users can select which filters to apply, and can move the desired filter to be placed either in a row or a column. Each Dynamic Crosstabs will show a list of filters, or ‘available data’ items (shown as gray boxes, and referred to in type with Uppercase Letters) such as Race, EL status and School Name. These ‘available data’ are unique to each tab available in the sub-menu. For example, the Spring Demographics tab shows ‘Parent in Military’ as an available data item but this does not show up in the ‘Available data’ list for the Third Friday of September.
Click one of the items in the ‘Available data’ list to drag-and-drop it either on a “Columns” or the “Rows” position. You can rearrange the data boxes you’ve selected as desired to obtain the data combinations you would like to view. A good example is the Spring Demographics snapshot page, shown below.
This crosstab is using the ‘Available data’ types of Grade, SPED Asmt in the Columns position, and Disability in the Rows position:

This crosstabs is using the same ‘available data’ types but through the drag and drop feature to change their position. In this arrangement, grade is in the Rows position, while SPED Asmt, and Disability are in the Columns position. The same information is provided, but the table is more compact.
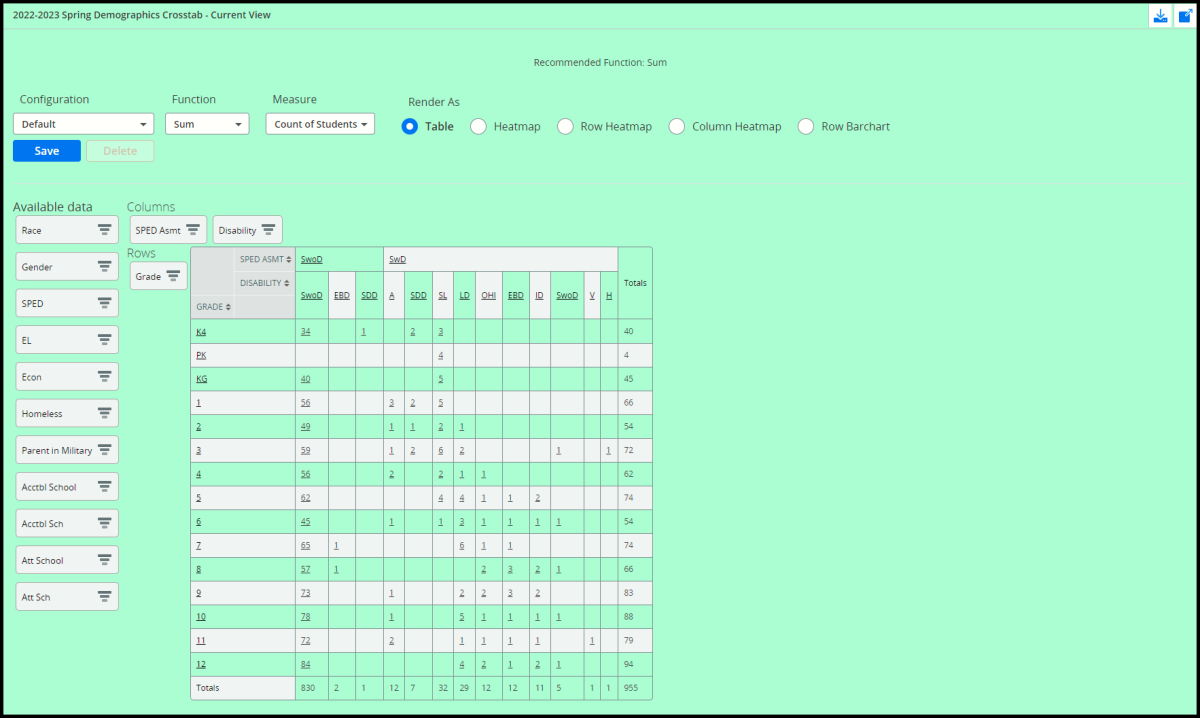
In this way, by dragging and dropping the available data types on each dashboard, your tables can be continuously, dynamically, adjusted as you decide which crosstabs (which available data types to place in a row or column position) to use. This allows you to create charts that display the data you desire in a manner that suits you.
Data can further be filtered by using the filter tool located on the right end of each data item (three narrowing bars symbol on the right edge of each gray box). Clicking the filter tool will create a pop-up window allowing you to select the desired values. Within the crosstabs table, the ‘available data’ filter you have selected will be underlined. Clicking the underlined filter title within the crosstab allows you to drill into the list of students for that filter. Your preferred combination of rows and columns can be saved for future use by clicking ‘Save’ next to Current Session and naming the configuration.
Dynamic Crosstabs Tips:
 There are many different functions available, but only Sum provides meaningful results for this data.
- Select one of the ‘Render As’ options to provide the best visual aid for your purpose.
- The results on this chart are drillable (if authorized) to an individual student. It first drills to a student list, then you can drill into a specific student.
-
Empty data cells mean no data is available for that combination of dimensions (Rows and Columns sections).
-
Use the save icon to save the chart configuration for use in a future session.
Refer to the Using the Dynamic Crosstab User Guide for more information.
Definitions of Applicable Crosstab Data Filters
Each subtab displays a unique dashboard with ‘available data’ filters that specifically apply to it. They are defined in detail on their respective ATD Dashboard pages.
The most commonly occurring filters are defined in detail below:
- Acctbl Sch/ool
- Att Sch/ool Name
- Disability
- EL/status
- ELP Code
- Gender
- Grade
- Homeless
- Race
- SPED
- Acctbl School - Accountable School Name: The fully spelled out name of each school, for example, Lincoln Early Learning or Sojourner Elementary. This filter works best for large(r) districts with many schools.
-
Acctbl Sch - Abbreviated Accountable School Name: Abbreviated names of each school, for example, Lincoln Ear or Sojourner E; maximum of 10 characters. This abbreviated name filter works better for smaller districts with fewer schools.
-
Accountable schools are schools that include students who are accountable (or were at the effective date of the snapshot) to their school/district, but attending a different school. For example, a student is attending a public school in their district of residence, but is temporarily attending a day-treatment facility for half-day treatment. The resident district school is accountable and attending. The day-treatment agency is only attending, and is not the accountable agency.
-
Refer to the data element page on District Accountability for more details.
-
-
Att School Name - Attending School Name: The fully spelled out name of each school, for example, Memorial High or Carver Intermediate. This filter works best for large(r) districts with many schools.
-
Att Sch - Abbreviated Attending School Name: Abbreviated names of each school, for example, Memorial H or Carver Int; maximum of 10 characters. This filter works best for small(er) districts with fewer schools.
-
Attending school counts exclude students accountable to the school/district but who are attending elsewhere. Attending school count displays the students attending this (selected) school.
-
Refer to the data element page on Submitting District for more details.
-
-
Disability - Checklist options for disabilities, also referred to as Special Ed program areas.
-
Options include:
-
A - Autistic
-
DB - Deafblind
-
EBD - Emotional Behavioral Disability
-
H - Deaf and Hard of Hearing
-
ID - Intellectual Disability
-
LD - Learning Disability
-
OHI - Other Health Impairment
-
OI - Orthopedic Impairment
-
SDD - Significant Developmental Delay
-
SL - Speech and Language
-
TBI - Traumatic Brain Injury
-
V - Blind and Visually Impaired
-
-
Visit the Disability data element page for more information.
-
-
Econ - Economic Disadvantaged Status - A yes/no/unknown indicator stating whether a child faces economic disadvantages (Econ Disadv) or does not face economic disadvantages (Not Econ Disadv).
-
Visit the Economically Disadvantaged data element page and the Direct Certification page for more information.
-
-
EL /EL Status - A yes/no/unknown indicator stating whether a student is currently identified as an English Learner who is receiving EL services. EL is preferred instead of ELL.
-
Visit the English Learners in Wisconsin page for more information
-
-
ELP Code - Indicated with a number 1-7, each number indicating a student’s degree of English Language proficiency (ELP). ELP code or classifications are defined in PI 13.08 Wis. Admin Code. Students with English language proficiency classifications of 1-5 are considered Limited English Proficient (LEP). For students in grade levels KG to 12, the value reported is expected to correspond to the results from the most recent administration of the ACCESS for ELLs exam. Students identified as English Learners (ELs) are assessed annually to determine their level of English language proficiency (ELP), ensuring that they are progressing to achieve full English proficiency. This would refer to a student who has an ELP code of 1-5. An ELP code of 6 indicates a student has succeeded in attaining full English proficiency, and an ELP code of 7 refers to a student who was never EL.
-
Visit the ELP data element page for more information.
-
-
Gender - The sex type of a students in WISEdata is referred to as gender in WISEid and WISEdash. Gender can be reported as male, female, or non-binary. Prior to the 22-23 school year, non-binary was not a reporting option.
-
Visit the Gender data element page for more information.
-
You may also visit the Uncommon WISEdata Situations page for more information about Data Elements for Transgender Students.
-
-
Grade - The grade level a student is placed in, indicated as: PK, K3, K4, KG, or 1-12.
-
Visit the Grade Level Placement data element page for more information.
-
-
Homeless - Indicates whether a child is homeless (Homeless), or not homeless (Not Homeless). Homeless students lack a fixed, regular, and adequate nighttime residence.
-
Visit the Homeless Status data element page for more information
-
-
Race - The racial group of a student, indicated as American Indian, Asian, Black, Hispanic, Pacific Isle, White, or two or more.
-
Visit the Race and Ethnicity data element page for more information
-
-
SPED - Indicates whether this is a student with a disability (SwD), or a student without a disability (SwoD).
-
Visit the Special Education Data Reporting FAQ page.
-
Frequently Asked Questions about Snapshot Data
- What are snapshots? In general terms, snapshots are pieces of data that are copied from active, dynamic tables in the DPI Data Warehouse (DW) - the data warehouse is the cloud where data is stored within the DPI after the nightly sync with WISEdata - at a specific point of time, to a “permanent” location to support current and future reporting. This facilitates reporting from an unchanging set of attributes, providing consistent, repeatable query results unaffected by the dynamics of real-world changes and corrections.
- The snapshot dashboards in WISEdash for Districts provide users with tools to query data captured in a snapshot and compare that data to their district’s current data. The purpose of the snapshot dashboards is for users to reconcile their data before the snapshot is taken. These comparisons can help the district identify and correct data reporting deficiencies in preparation for a future snapshot event.
- What data is captured in a snapshot? All current student attributes recorded in the Data Warehouse such as race, gender, ELL status, etc. - with the exception of disability information - is captured as of the date the snapshot is taken. This means that the snapshot will reflect the current data values from your SIS (which get sent to DPI nightly) regardless of the intended use of that particular snapshot. For example, if a student was not economically disadvantaged on the Third Friday of September (TFS) but became disadvantaged just recently, a TFS snapshot taken today would record that student as disadvantaged because that is the most recent data that has been submitted.
- Disability information, however, is handled somewhat differently. Disability status, disability codes, education environment, and parentally placed private have associated begin and end dates that are also recorded in the snapshot. This allows the appropriate effective values to be selected for the intended use of that snapshot - i.e. disability attributes effective during the third Friday of September to be used in the TFS snapshot and those effective on October 1 for the Oct. 1 Child Count snapshot.
- All enrollment changes and attendance values for the school year-to-date are captured with every snapshot.
- How will snapshots be used? The snapshots will serve as the permanent data source for certified reporting by DPI. This includes TFS Count Date enrollment, Oct. 1 Child Count, certified attendance, high school completion, dropouts, statewide assessment demographics, and others. Refer to the Snapshot Preparation - Detailed Guide (slide deck) for more information about how to use these dashboards to prepare for an upcoming snapshot.
- How may data in the snapshot be different than the WISEdata portal? Data shown on these dashboards and all other WISEdash dashboards may differ somewhat from data shown on the WISEdata Portal for a number of reasons. Most often, this is due to data reporting errors that cause data values to be suppressed or rejected from loading into the Data Warehouse. In addition, data is loaded nightly into the Data Warehouse (this is the data which feeds into WISEdash) instead of being updated in real time as with WISEdata. Please continue to examine unresolved errors in the WISEdata Portal and rectify these whenever possible. WISEdata is a continuous process that requires regular attention to maintain accurate and current data
- When viewing snapshot data in WISEdash, it is normal and expected that current WISEdata values would begin to change over time as updates are made to the student data in your SIS. Changes made in your SIS will flow through WISEdata to the Data Warehouse nightly and be reflected in the next snapshot taken. As a reminder, however, once a snapshot has been taken, the data in that report is static, and changes will not be made to that snapshot.
-
Will a student who transferred out continue to show in the WISEdash dashboard?
Whether or not a student shows in the dashboard depends on where the student went after leaving your district. If the student transferred to another reporting agency, such as another public district, all reporting accountability follows to the new agency. If the student transferred out of state, homeschool, or to a non-choice private school, your district is still accountable for the student's data as the last reporting agency in WISE for the current school year.
- At what time of year should the snapshot dashboards be used? The snapshot dashboards are designed to assist with verification and review of student data prior to the date on which the snapshot will be taken. In general, the snapshot dashboards are not intended for historic review. The October 1 Child Count snapshot Dashboard is an exception as this count is only available as a snapshot dashboard at present. At the beginning of the school year, snapshot dashboards for Attendance, Discipline, and Year End Completion are valuable to review the quality and accuracy of student data outcomes and demographics for the prior school year. Beginning October 1, review of the Third Friday of September and October 1 Child Count snapshot dashboards is critical to ensure timely and accurate data in the fall snapshot. In May, the Spring Demographics is useful to review the current state of demographics, but not outcomes, during the spring assessment windows.
- What is the SPED Assmt? The special education assessment (SPED assmt) is a demographic category that captures students in a special ed status over a range of time instead of at a point in time. Most of the demographic categories that are available for use in the crosstab display student counts as of the present moment. ‘SPED Assmt’ displays any student who had been reported as special ed within the date range, even if they are no longer reported as special ed. This is valuable when compiling data related to assessments. This is a calculation performed within WISEdash, not a data element submitted by a district. Results are displayed on the Spring Demographics snapshot.
- Why are some charts in green and others in purple? Two dynamic crosstab charts are provided. The Current View chart is green. It displays a single year of data determined by the Current View Year filter, annotated across the top of the screen, below the menu and subtabs. The present school year plus one previous year are available. Generally, you will want to use the current school year during preparation for this snapshot because the snapshot is taken during that school year. The Snapshot View chart is purple. displays a single year of Count Date snapshot data determined by the Snapshot View Year filter.
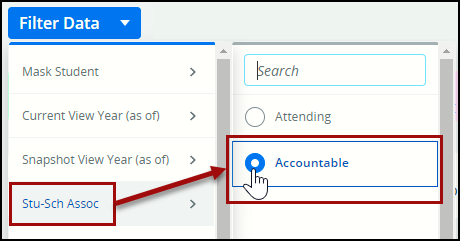
- What’s the difference in data between Attending and Accountable in the student-school association (stu-sch assoc) filter? If the student-school association is set to Attending, students assigned to attend the selected district's schools will be included in the chart. Dashboards default to Accountable. If Accountable is selected, students for which this district is accountable (but not necessarily attending) will be included in the chart associated with the name of both the attending and accountable schools.
Resource Links