WISEdash Graphs with Missing Data or No Data
It is not unusual to encounter situations where data appears to be missing in WISEdash. This results from a number of causes. Some of these can be remedied by changing your filter selections.
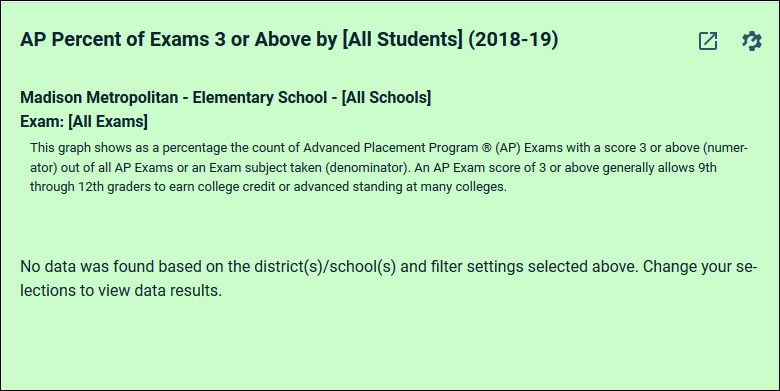
EXAMPLE: In the picture below, you were trying to view Advanced Placement ® Exam data with elementary school types chosen. AP exams are only given in high schools. The following message results:
"No data was found based on the district(s)/school(s) and filter settings selected above. Change your selections to view data results."

WHAT'S HAPPENED?
The filter settings within the Filter Data button are incompatible with this graph. You may have been viewing elementary school data on another dashboard by setting the School Type filter to Elementary Schools before moving to the AP Exam dashboard. AP tests are not administered to elementary school students.
FIX:
- Change the School Type filter to [All Types].
FIXES FOR OTHER SITUATIONS:
- Try a different filter selection such as changing the district, school or grade level. For ACT and AP topics, make sure a high school or secondary grade is selected.
- The school may have been closed. Try a different School Year filter.
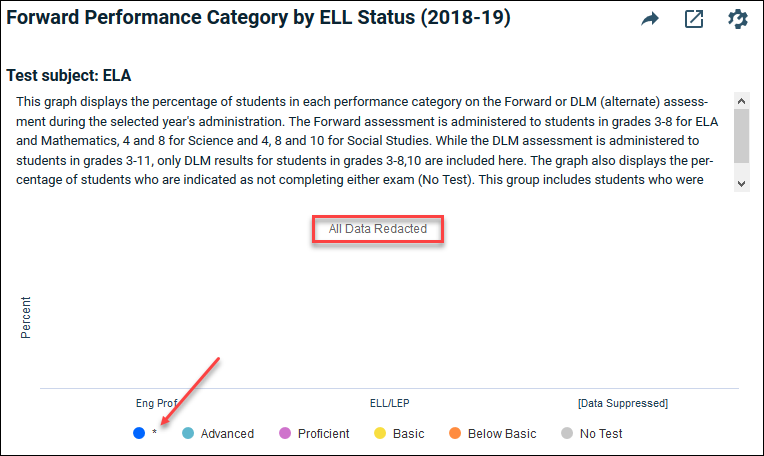
EXAMPLE: In the picture below, you were trying to view Forward exam data grouped by English Language Learner status. The following message results:
"All Data Redacted"
WHAT'S HAPPENED?
Data has been masked (redacted) to protect student privacy - in this case, a small number of English learners. A message "All Data Redacted" shows in place of the data bars. The graph legend shows an item with an asterisk *.
WISEdash displays an asterisk * in a table instead of a number and removes the bar or point in a graph when it's required to mask data with small groups of students. This masking is called redaction and is required by federal law to protect student confidential information. The asterisk * is different than "no data" or "--" which indicates there were 0 students in the category of data.
FIX:
- The data cannot be shown in the graph with your current filter selections.
- If you have selected a single Tested at Grade, try selecting [All Grades] for a larger group of students.
- If you have selected a single school, try selecting [All Schools].
More about student data privacy.
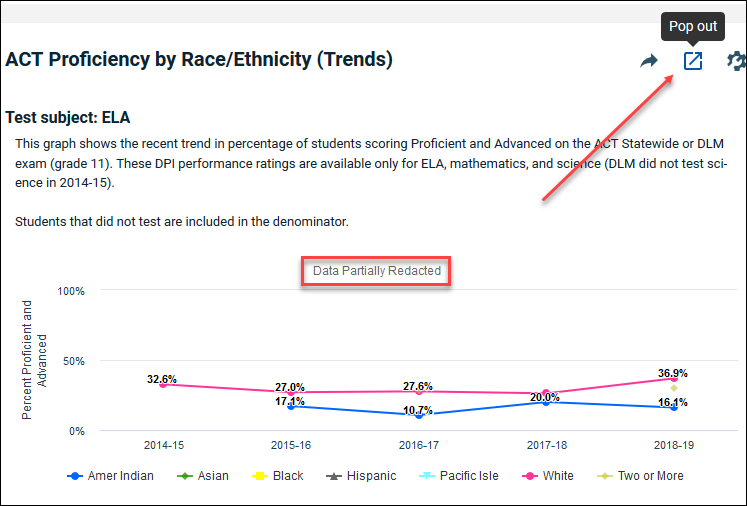
EXAMPLE: In the picture below, you are viewing the ACT results grouped by Race/Ethnicity. The data points for White and Amer Indian are shown, other races appear to be missing. The following message is displayed:
"Data Partially Redacted"

WHAT'S HAPPENED?
One or more data points represent small groups of students. These points, and possibly others have been masked to protect privacy (redaction).
FIX:
- The missing data points cannot be shown based on your filter selections. However, some information on these data points may be available in the data grid. Click on the Pop-out button in the toolbar, then select the Data tab. See which student groups were redacted (*), and possibly the student counts for those groups.
- Broaden your filter selections by choosing [All Schools].
- Change your Group By selection.
If you feel there is a problem with the data, submit a Help Ticket providing as much information about your filter selections as possible.
