About the Data | Dashboard Description | Using the Data | Understanding Effect Size | Resources
About the Data
The achievement gap dashboards display gaps in performance between a target group (generally a minority group) and a comparison group (generally a majority group) at school, district, and state levels. Groups include race/ethnicity, gender, economic status, disability status, and English proficiency. Graphs include Forward Exam, ACT statewide assessments and attendance rates. The “Single Year” dashboard displays gaps for all applicable student groups for a single year, while the “Trends” dashboard displays gaps over time for a single target and comparison group.
Dashboard Description
How do the Achievement Gap dashboards differ from other dashboards?
Different Display Structure
The structure of the achievement gap graphs is different from that of the other graphs in WISEdash that you may be familiar with. There are four major differences in the way that results are displayed in the Achievement Gap dashboards:
- Gaps-based instead of Results-based: unlike other dashboards, the purpose of these dashboards is not to display the results for a given subgroup but rather to display the gap in results between two subgroups.
- School-level detail instead of Student-level Detail: in most secure dashboards, users can drill down to student-level detail but because this dashboard is based on the gaps between groups of students, not on individual student results, it shows gaps at the school-level instead of student-level. Users can drill down to school-level detail.
- Inclusion of State and District-level Comparison: Although state- and district-level results are displayed in WISEdash public, such aggregated results are typically not displayed in WISEdash for Districts. The state and district gaps are displayed here to provide additional comparative information to the user.
- Group size filter: By default, gaps are not displayed when either the target or comparison group has less than 20 students. This is done because users need to be extra cautious when analyzing data for very small groups, which can be statistically unstable. However, if users would like to see the gap data regardless of the number of students you can simply set the Small Groups filter to “Show.” This can be chosen for those who want to focus on very small numbers of students. Note that gaps cannot be shown when there are no students in either the target or comparison group.
Rather than describing the performance of one student group, the achievement gap graphs compare the difference in performance of two groups. The performance of two groups must be compared in order to calculate a gap. Those two groups are the target group and the comparison group. The target group is the group that the user is interested in studying (students with disabilities, economically disadvantaged students, English language learners, female or male students and students of the race/ethnicity groups not selected with the Comparison Race/Ethnicity filter). The comparison group is the group that the target group is compared to (students without disabilities, non-economically disadvantaged students, English proficient students, students considered to be of the gender that was not chosen as the target group and students of the race/ethnicity group selected with the Comparison Race/Ethnicity filter).
Two Dashboards
To better represent the achievement gap data, two related dashboards are provided. These dashboards—Achievement Gap (Single Year) and Achievement Gap (Trends)— present context-based single-year gap data for each applicable student group and multi-year trend data for a particular gap for a single student group, respectively. When used together, the two dashboards allow for a more complete picture of school-based achievement gaps.
The single year dashboard displays achievement gaps as bars. Each bar shown in the graphs characterizes a school, district, or state gap in performance between groups. The larger the bar, the larger the gap between the two groups. The smaller the bar, the smaller the gap between the two groups. If the bar is positive then the comparison group is performing better than the target group. If the bar is negative then the target group is performing better than the comparison group. The bars representing the gaps on the Forward and ACT graphs are shown in effect size units. See the “Effect Size” section below for an explanation of effect size. The attendance graph bars are simple differences in the attendance rates between the target and comparison groups. For example, one bar will represent the gap between students with disabilities and non-disabled students in the school, another bar will represent that gap in the district, and a third bar will represent that gap throughout the state.
As with the single year dashboard, the trends dashboard displays the size of a gap between two groups, using effect size to represent the gap (and simple differences for the attendance gap). However, instead of showing a single year gap for each applicable student group, the trends dashboard displays the gap between a target and a comparison group over multiple years. The dashboard allows for the selection of the target group (and the race/ethnicity comparison group, if applicable) in order to view the achievement gap trends of all available student groups. Student performance on ELA and mathematics is displayed beginning with the 2014-15 school year. Science performance is shown beginning with the 2014-15 school year for ACT and 2015-16 for Forward. Social studies performance (Forward only) is shown starting with the 2015-16 school year.
Different Security Structure
Because the Achievement Gap dashboards display results in a different manner, WISEdash user security mechanisms are applied differently as well.
- Summary-level Security: Users who don’t have drill down access to other dashboards will not be able to view school-level detail despite the fact that such detail is not student-level detail.
- District-level Security: If a user has access to view district results—regardless of whether the user is restricted at the school-level—they can view district and state-level results in the metric summary of the dashboards. If a user does not have access to a district, they cannot view district-level results but such restricted district results are included in the aggregate of state-level results.
- School-level Security: Users who are limited by security to select schools in a district –who can otherwise view detailed information – will only be able to view detailed information for schools for which they have access. Further, such users would not be able to see summary school-level information for the schools for which they do not have access; however, school-level results are included in aggregated district and state-level results regardless of security.
- Economic Status Security: For those users who are restricted from disaggregating or filtering by or -otherwise seeing- economic status, will not see economic status rows in the Achievement Gap detail. Further, gap comparisons for economic status (including school, district and state-level), will also not display in the summary view for such users regardless of whether there are gap data to present.
Which student-level data are included?
Only students with a Forward Exam or ACT test result are included in the Forward, and ACT graphs, respectively. Students who were not tested or who were administered the DLM alternate assessment are not included. All students are included in the attendance graph. FAY status is not considered for the achievement gap dashboards; both students who are and are not FAY are included in the results. Provided there are enough students for a comparison, there will be a school, district and state bar or line for each race, gender, disability status, economic status and English proficiency.
Unlike other dashboards, when a user clicks one of the bars or lines in the graph, the achievement gap dashboards do not display a student listing nor do they drill down to a student profile dashboard. Rather, they display the school, district and state-level averages and counts that are used to calculate gaps. Individual student results are not available from these dashboards.
How can we use the data from this dashboard to improve student outcomes?
These dashboards allows users to easily identify and visualize gaps of any size, and to do so across different measures that have different scales. Users may also want to compare the gap size to external benchmarks, to similar groups, to the district or state for perspective. Because effect size is used in the dashboards, users could compare gaps on the Forward Exam to gaps on The ACT. This would allow educators to focus their school improvement efforts on specific grades or content areas, for example.
About a third of Wisconsin districts are very small, enrolling 500 or less students. In these districts, educators may need to see data for very small groups of students. In other districts, educators may be focused on helping a specific student group – perhaps 14 ELL students – and they want to dig into the achievement gap data. In these cases, educators would select the “Show” filter and be able to see what the effect size for different gaps are, and make appropriate plans based on that.
For specific strategies used to close achievement gaps, please see the Promoting Excellence for All webpage and the associated eCourse.
Understanding Effect Size
What is effect size?
Effect size is a standardized measure of the difference between groups on a given outcome.
Why is an effect size calculation used?
Effect size is useful because, as a standardized measure, it allows users to evaluate the magnitude of the difference between two groups. It does so in the context of other differences in the school or district as well as in the context of published research on relevant interventions.
Specifically, in the case of the Achievement Gap dashboards, effect size calculations enable a discussion of achievement gaps across different assessments with different scales. This allows for comparisons over time and across different measures, and helps schools focus their improvement efforts on areas most in need.
How is effect size calculated?
The effect size shown in the achievement gap dashboards is a standardized mean difference. This means that the effect size is measured in standard deviations. For example, an effect size of 1.0 means that the gap between groups is one standard deviation. An effect size of 0.5 means that the gap is half of one standard deviation.
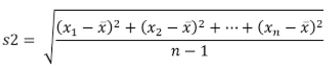
The formula used to calculate the achievement gaps dashboards effect sizes is Glass’ delta. To calculate Glass’ delta, subtract the mean of the comparison group from the mean of the target group. Then divide that difference by the state-level standard deviation of the comparison group.
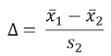
where
For example, to calculate the effect size for a school-level math gap mean scale score between Hispanic students and white students, first subtract the school-level mean scale score for Hispanic students from the school-level mean scale score for white students. Then divide this difference by the state-level standard deviation for white students.
How should educators interpret an Effect Size score?
Direction of the Effect Size
Effect sizes can be positive or negative. For example, if the effect size of the Hispanic-White gap in ELA is 0.4, this indicates that the mean value associated with the white students is higher than the mean value associated with the Hispanic students. Hence, we say there is a Hispanic-White gap. Hispanic students are the target group and white students are the comparison group. In order to close the gap, we need to raise the ELA achievement of Hispanic students so they are our target group. We are comparing their performance to white students so white students are the comparison group.
A negative effect size would indicate the opposite; that the mean value associated with the Hispanic students is higher than the mean value associated with the white students. This happens when the target group outperforms the comparison group.
Magnitude of the Effect Size
An effect size of zero means that there is no difference between the two groups. A small effect size means that the difference between the two groups is small. A large effect size means that the difference between the two groups is large. However, there are a number of ways to interpret the magnitude of an effect size. One way to interpret the magnitude of an effect size is to compare that effect size to benchmarks or observations reported in scientific literature.
- For example, in Statistical Power Analysis for the Behavioral Sciences (1988), Cohen describes effect sizes of 0.2 and smaller as small, effect sizes of 0.2 to 0.5 as medium, and effect sizes larger than 0.5 as large. Threshold lines at effect sizes of 0.2 and 0.5 have been added to a number of Achievement Gap graphs to better identify whether a gap is small, medium or large based on this determination.
- Another benchmark has been set by the federal What Works Clearinghouse (WWC). When evaluating intervention programs, WWC considers effect sizes of 0.25 and greater to be “substantively important.”
- John Hattie’s Visible Learning: A Synthesis of Over 800 Meta-Analyses Relating to Achievement provides the effect sizes associated with many education interventions.
- One more approach is to compare school-level effect sizes to district-level or state-level effect sizes. Similarly, effect sizes can be compared across groups or from one outcome to another, such as from the Forward Exam to the ACT.
These benchmarks may not be appropriate in every context but are a good starting point for interpretation.
How Does Effect Size Differ From Statistical Significance?
Effect size helps users to evaluate the magnitude of a difference between groups. Statistical significance determines whether the difference is likely to be due to chance. For example, the What Works Clearinghouse (WWC) uses statistical significance to determine if the difference in outcomes between treatment and control groups in a study is likely to be due to chance, and uses effect size to determine if the difference is large enough to have a substantive impact on the treatment group.
It is possible for a difference between groups to be significant without being substantively important. Statistical significance is dependent on sample size. If a comparison is poorly designed statistical significance can simply mean that a large sample was used. Effect size is independent of sample size.
Resources
Achievement Gap Resources
-
Achievement Gap Dashboard - Understanding Effect Size PPT
- Promoting Excellence for All strategies, research and companion eCourse
- Wisconsin Disproportionality Technical Assistance Network Resources
Effect Size Resources
- Cohen, J. (1988). Statistical power analysis for the behavioral sciences. Hillsdale, NJ: L. Erlbaum Associates.
- Hattie, J. (2009). Visible learning: A synthesis of over 800 meta-analyses relating to achievement. London: Routledge.
- Hill, C., et. al. “Empirical Benchmarks for Interpreting Effect Sizes in Research.” (2007). Retrieved from http://mdrc.org/sites/default/files/full_84.pdf
- Lipsey, Mark W., et al. “Translating the Statistical Representation of the Effects of Education Interventions into More Readily Interpretable Forms.” (2012). https://ies.ed.gov/ncser/pubs/20133000/pdf/20133000.pdf
- What Works Clearinghouse. (n.d.). Procedures and Standards Handbook Version 3.0. Retrieved from https://ies.ed.gov/ncee/wwc/Docs/referenceresources/wwc_procedures_v3_0_standards_handbook.pdf