How-To Audit Data Quality for Economic Disadvantaged Status Data
Overview
This page goes into specific detail about how to correct Economic Disadvantaged Status (EDS) data as you prepare for the December snapshot. You can refer to the Customer Services Team Communication KBA about WISEdata - Economic Status and Food Services Eligibility Data as well.
Click the links below to navigate to different sections of this page:
EDS Data in WISEdata Portal
EDS data can be found on a Student Specific Detail screen in the demographics tab. Each school a student attends needs to report a school-level demographics record.
To locate enrollment data on WISEdata Portal, use the following breadcrumbs:
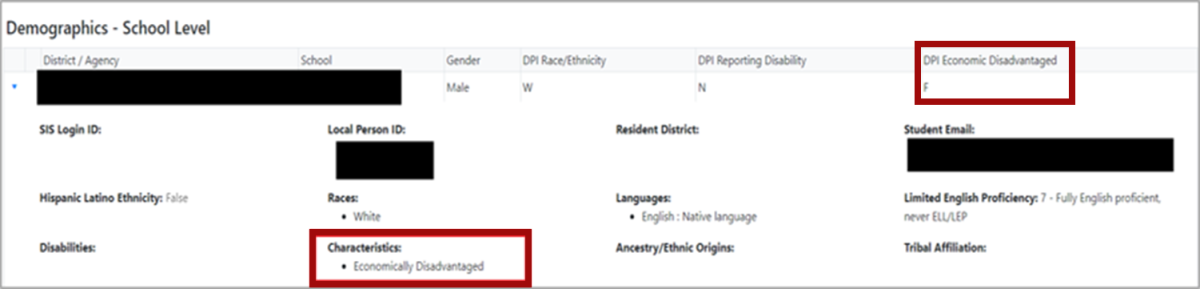
- WISEdata Portal > Agency tab > Student Search > (enter required details) > Specific Student Detail Screen, opened as a new tab in your browser > Demographics > Demographics - School Level > Characteristics.
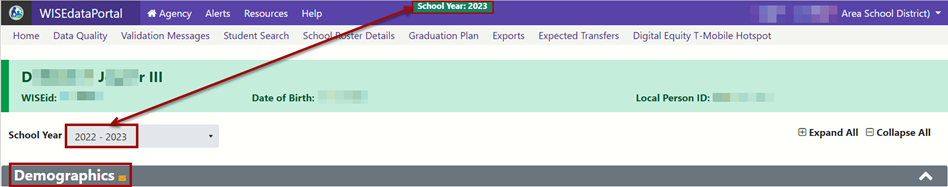
Make sure you have the correct school year selected.
The Specific Student Detail screen will have the student’s name, WISEid, date of birth and Local Person ID in a green banner across the top of the screen.
On this demographic screen, under characteristics, the data element should read either: economically disadvantaged or not economically disadvantaged. This is different than the DPI Economic Disadvantaged calculated field, which will display either F, R, A, or N.
EDS Data Elements
A complete list of data elements that could potentially be associated with a student's EDS data can be obtained by applying the "Food Service" filter and clicking "apply" on the WISE Data Elements page. Some key data elements that relate to the EDS are:
Reviewing Validation Messages in WISEdata Portal
On the Validation Messages screen, you can use the options under the Filters section to filter for "Demographics" and "Other Programs" validation messages. You could also potentially use Enrollment, since enrollment is based on Third Friday of September (TFS) count, and that count date is the date upon which economic disadvantaged status is captured.
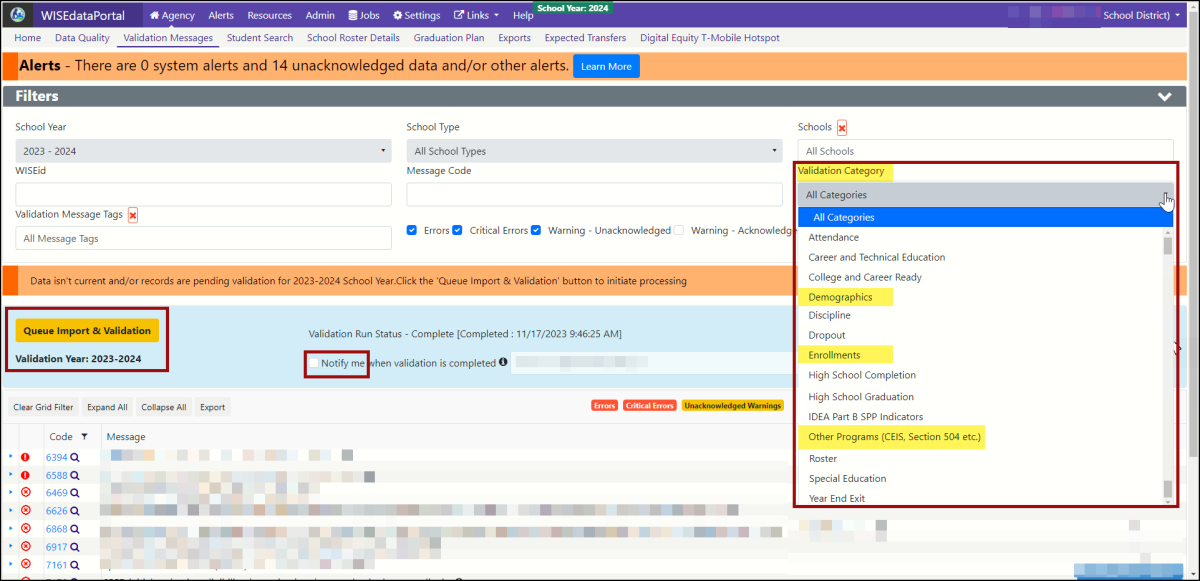
- If the characteristic, economic disadvantaged, is missing in WISEdata Portal, you can receive error 7052, or error 6370.
- If the school food service program association has not been submitted by the school, you can receive error 6816.
- Only critical errors will prevent EDS data from flowing to the data warehouse/WISEdash for Districts.
Click the expander tool (the small, blue triangle in the very first[far left] column) to show details on each validation message.
How to Verify Data Flow for EDS Data
You can verify your student’s EDS data by reviewing three different exports. Reviewing these export will allow you to see all of your students at once for review and spot checking.
The Student Characteristics Export
Use the following breadcrumbs:
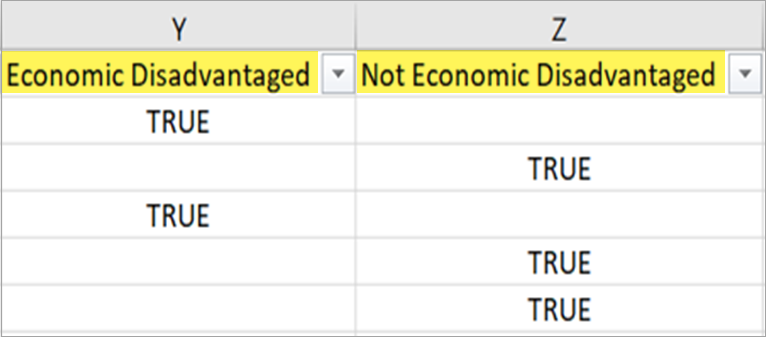
- WISEdata Portal > Agency tab > Exports screen > Student Characteristics > download > view columns Y and Z.
- Column Y = Economic Disadvantaged Status, True or False.
- Column Z = Not Economic Disadvantaged Status, True or False.
This value is reported based on the student's Direct Certification, or Alternative Household Income Form, submitted as part of the student's enrollment each school year.
The Student Food Service Program Associations Export
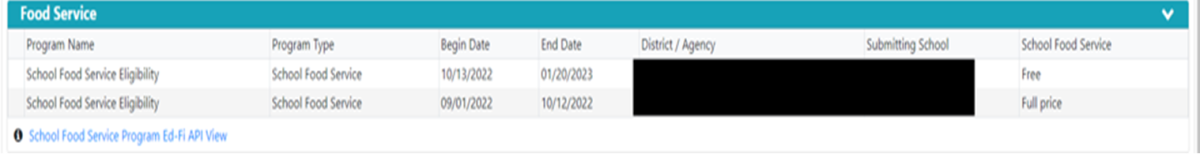
The student food service program association indicates which students receive meals through federal school meal programs, such as National School Lunch Program, Summer Food Service Program, etc.This teal "Food Service" header is located under the gray "Programs" header.
All students in all grades from all schools that submit to WISEdata have food services data displayed:
Use the following breadcrumbs:
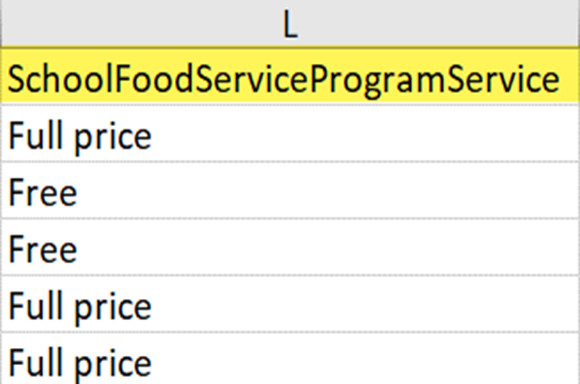
- WISEdata Portal > Agency tab > Exports screen > Student Food Service Association > download > view column L.
- Column L = School Food Service Program Association
A student's Food Service Eligibility is reported as a Food Service record and shows the reported lunch program the student is participating in. You can also see this in the Student School Food Service Program export.
The Enrollment - 3rd Friday of September Export
This export displays the DPI calculated value (obtained by calculating both economic status and food services eligibility) of DPI Economic Disadvantaged Status.
Use the following breadcrumbs:
- WISEdata Portal > Agency tab > Exports screen > Enrollment - 3rd Friday of September > Student School Food Service Program Associations > download > view column L.
- Column L =DPI Economic Disadvantaged Status
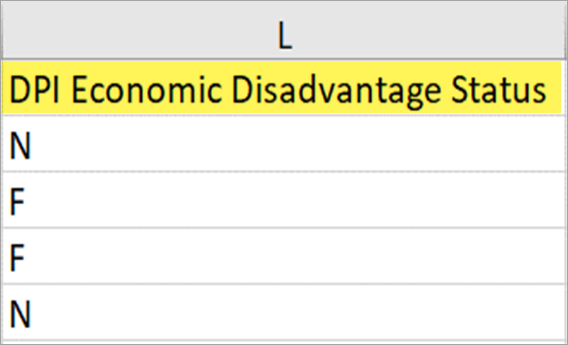
Combining the demographic econ status and food service eligibility of a student, DPI will calculate the student's Economic Disadvantaged Status. These combined values result in what gets reported for FRAN. It is important to accurately report and review both of these values to ensure your student population is being reported correctly.
NOTE! For CEP Schools
As a note, CEP schools should NOT report all students Economically Disadvantaged. Even if you are providing Free Lunch to all your students, the student's individual demographic economic status is still important for FRAN. In the calculation above, you can see that just because a student is receiving Free Lunch, if their demographic economic status is No, they will not be reported as Economically Disadvantaged.
Parents Refuse to Report Economically Disadvantaged Status: Parents should be encouraged to report this information. If they refuse to report, the LEA is responsible for reporting the student as "Not Economically Disadvantaged." LEAs should not default into making a 'best guess' about a family's answer to this status question. It can be a common misunderstanding in a CEP school, where all students receive free-lunch, that it doesn't matter if Economically Disadvantaged Status is reported, but it does matter so that all data that an LEA reports truthfully and accurately reflects the student. This also applies to students in the Direct Certification system: if a parent refuses to provide the information, the LEA must report the student as 'Not Economically Disadvantaged' and 'Full Lunch.'
Reviewing WISEdash for Districts for EDS Data
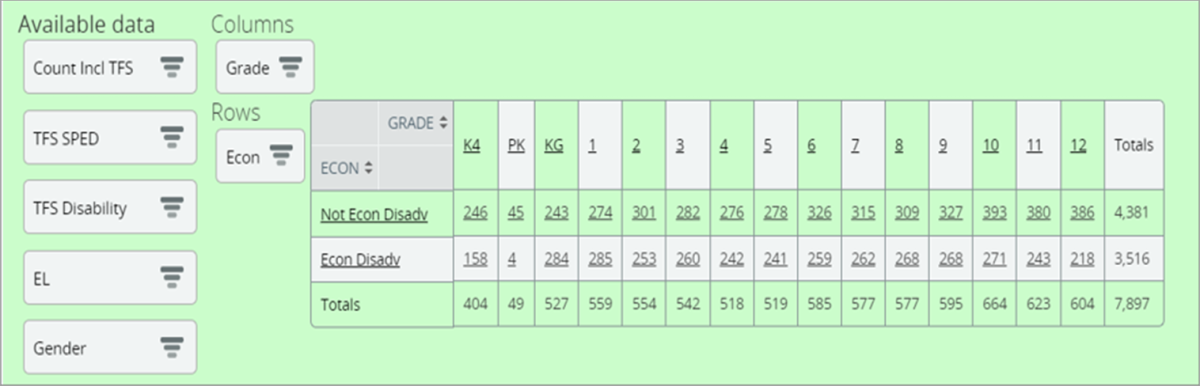
In WISEdash for Districts, if you have the Economic Analyst user role, you can use the Econ filter in any dashboard to review your counts.
Use the WISEdash for Districts, Snapshot, Third Friday of September dashboard to review Econ Status since this pulls into Report Cards. If any of the count totals are incorrect, review the exports in WISEdata or the student records for any impacting validation messages or review to see if your SIS has the correct values submitted and pushed to WISEdata.
Impact of EDS Data on Report Cards
This data is important because it is heavily disaggregated for reporting and accountability purposes. This means that many sub-categories of data are created to compare and contrast between students who are economically disadvantaged and those who are not economically disadvantaged, such as attendance, retention, dropout, and graduation rate data by economic status. Economically disadvantaged status indicators were included in Pre-ID files for statewide testing and used for disaggregated reporting of test results and participation.
Students who are economically disadvantaged feature on the front page of the report card. The percentage displayed is calculated from the number of students with Economic Disadvantaged Status = True who were counted in the TFS Count Inclusion = Yes.
- This percentage also determines the relative weight of Achievement and Growth in calculating the report card overall score. More information about these and other calculations can be found on the Report Card weighing calculator tool.
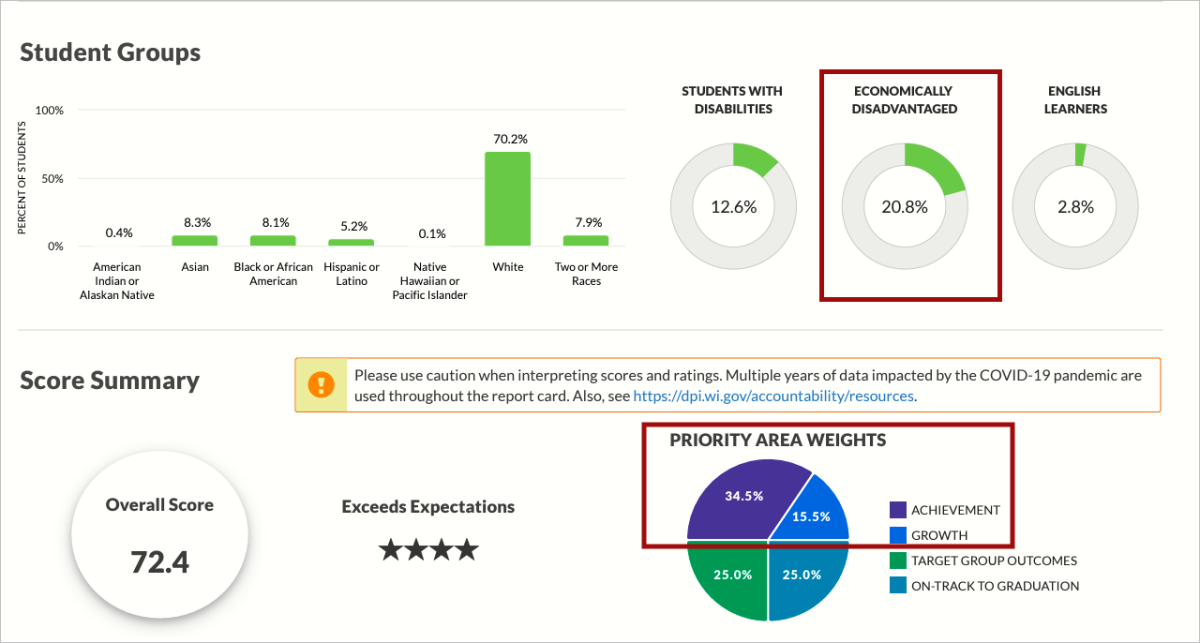
- The percentage of economically disadvantaged students from this TFS group drives the relative weight of Achievement versus Growth priority area scores in calculating the report card overall score and rating.
Didn't Find What You Needed?
![]()
The Customer Services Team is here to help!
Please submit a Help Ticket so we may better assist you.