Digital Equity Public Portal Dashboard Information
Public reporting on statewide digital equity data is available through the WISEdash Public Portal and through interactive internet access maps. Using the Digital Equity dashboard, you can view data reported by students and families to public school districts about internet access, internet access quality, and device access across Wisconsin. With the interactive maps, you can see internet access and performance data visualized on a statewide map of school districts.
About the Data
Data in the WISEdash Digital Equity dashboard and digital equity maps comes from students' and families' answers to the Internet Access at Home Survey, which school districts can use to gather data on home internet and learning device access for students in their districts. While this is an optional data collection, DPI encourages districts to collect this information and push it to WISEdata to help drive statewide initiatives to improve digital learning equity in Wisconsin. The more data districts can collect on internet and device access, the more accurate a picture the data can provide, and the better we can help students get the access they need to succeed in online blended learning.
The metrics included in the Digital Equity dashboard are updated nightly and can change based on data submitted to WISEdata by districts.
Access the Digital Equity Dashboard
You can access the Digital Equity dashboard by clicking the direct link here.
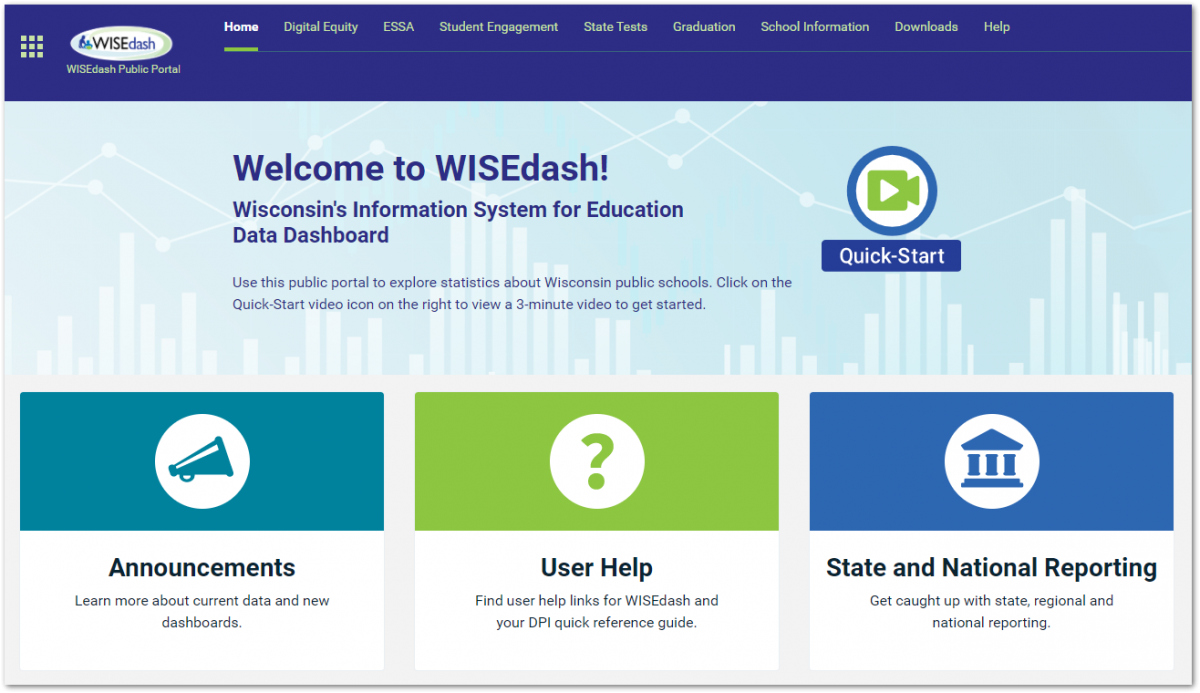
You can also access the public Digital Equity dashboard from the WISEdash Public Portal home page:
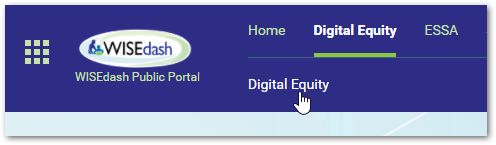
At the top of the screen, select the Digital Equity category. Then, in the menu below the category, select Digital Equity again.
Digital Equity Dashboard Tour
The Digital Equity dashboard features four metrics that show district-reported data about students' internet and learning device access across the state. These metrics include:
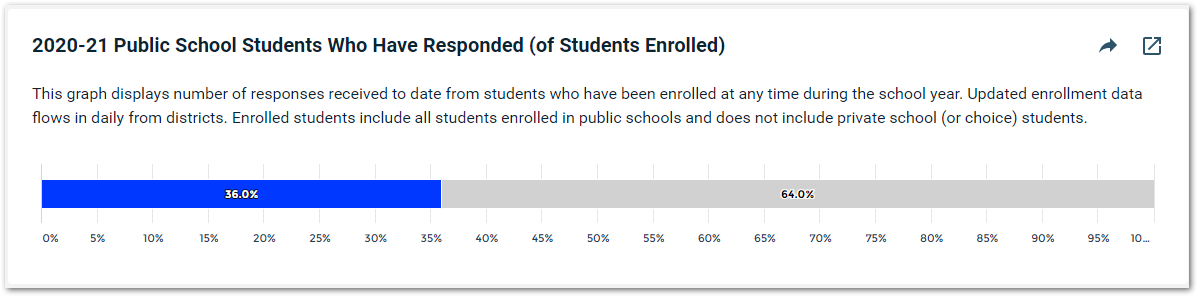
Number of Responses
The first metric shows the total number of responses from public school students enrolled at any time during the displayed school year.
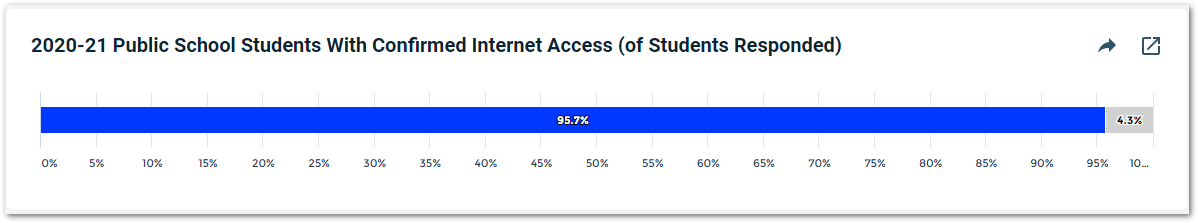
Students with Confirmed Internet Access
The second metric shows the percentage of respondents who have internet access at home.
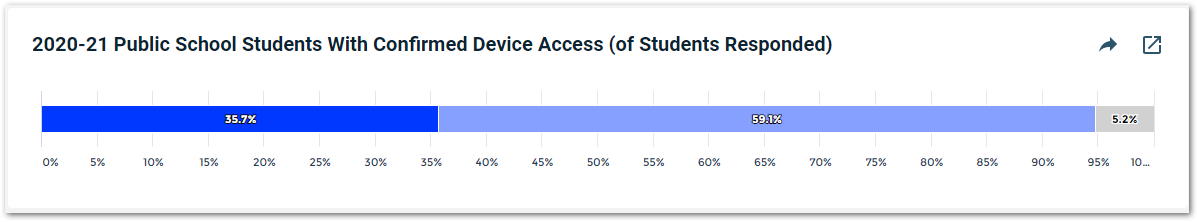
Students with Confirmed Device Access
The third metric shows the percentage of respondents who have access to a learning device, such as a laptop computer or tablet. The dark blue bar shows students with access to a personal learning device, while the lighter blue bar shows students who have access to a school-provided learning device.
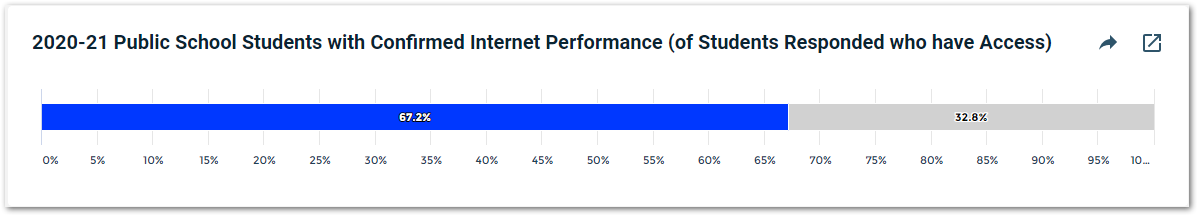
Students with Acceptable Internet Performance
The fourth metric shows the percentage of respondents whose home internet access allows for online blended learning, including reliable video streaming.
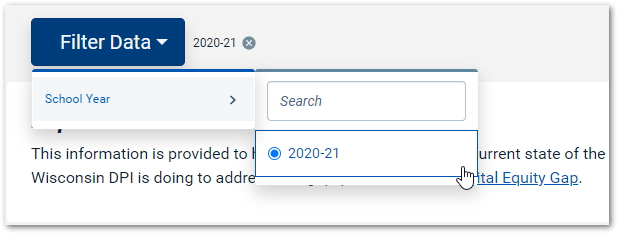
Filter Results by School Year
You can use the filter options in the top-left corner of the Digital Equity Dashboard to determine which school year the dashboard displays data for. Currently, only the 2020-21 school year is available. As data for future school years is reported, filter options for those years will be added.
Digital Equity Maps
On the interactive Digital Equity Maps, you can see internet access and internet performance data for individual school districts across the state of Wisconsin. Use the tabs at the top of the page to switch between the Access map and the Performance map. Data showed on these maps are updated periodically.
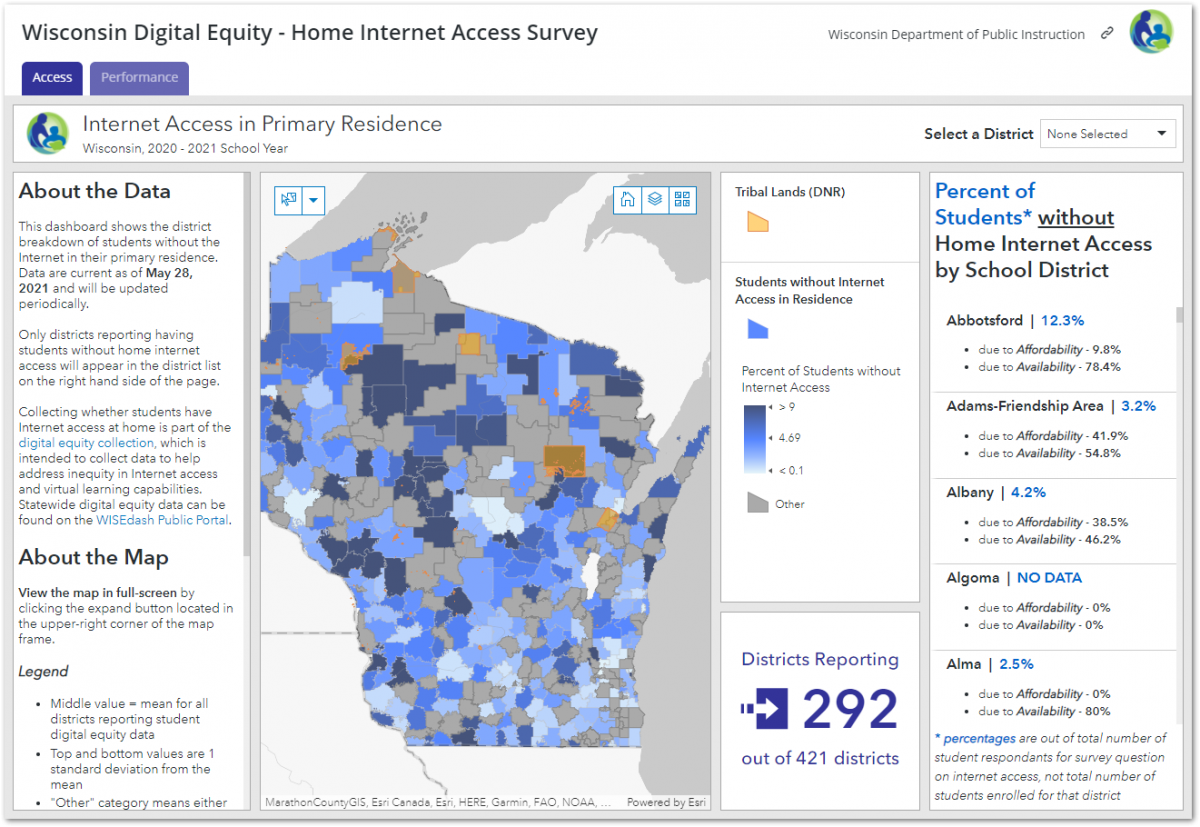
Internet Access in Primary Residence Map
This map shows the district breakdown of students without the Internet in their primary residence. Only districts reporting having students without home internet access will appear in the district list on the right hand side of the page.
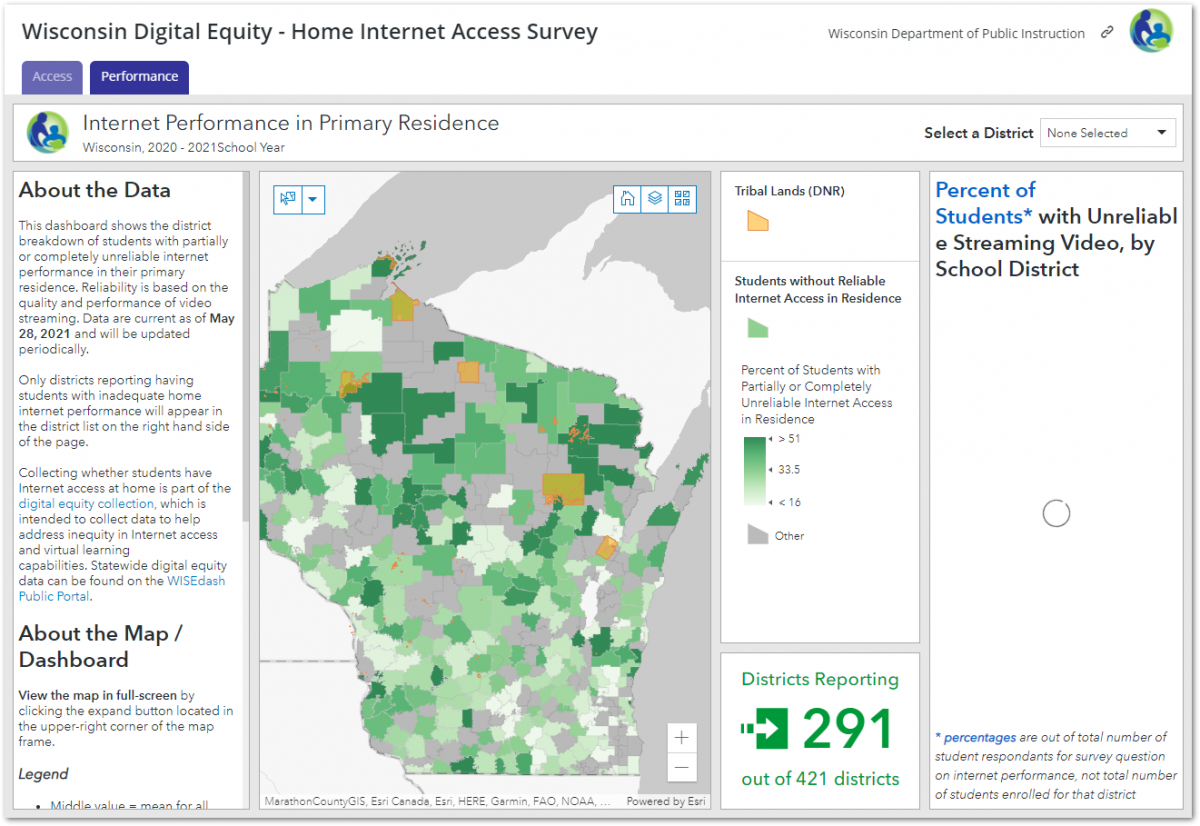
Internet Performance in Primary Residence Map
This map shows the district breakdown of students with partially or completely unreliable internet performance in their primary residence. Reliability is based on the quality and performance of video streaming. Only districts reporting having students with inadequate home internet performance will appear in the district list on the right hand side of the page.