RUBRIC EXPLORER REPORT TOOL
support for users with a high level of
administrative rights
support for users with a high level of
administrative rights
Rubric Explorer Report Tool
Purpose: The Rubric Explorer displays data that is collected through a rubric by representing the information in a graphical format (a one-dimensional heat map), which portrays the frequency with which each component/descriptor/criteria in a rubric was selected across users, buildings, departments, or the district as a whole.
Note: The Rubric Explorer shows results in reports based on evaluation rights, so if you create a report with all of the teacher data for the district, each administrator can run that same report and they would only see the results for the users they have rights for.
To Access follow the path: Evaluations > REPORT TOOLS > Rubric Explorer
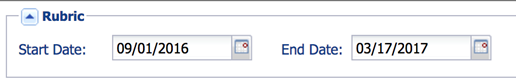
- In the "Rubric" section specify the start and end date you wish to report on.
- Additional filters include Classification, Eval type, Component and Form. Use the drop-down arrows then the checkboxes to select the desired Evaluation Types, Components, and/or Forms from which the report should pull/display data.
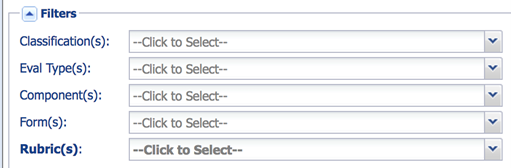
- In the "Filter" section of the Rubric Explorer, click the down arrow to select(s) the rubric that you would like to use as the basis for the report.
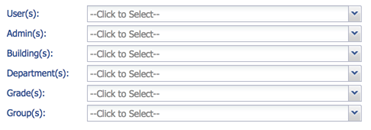
- From the right side of the "Filters" section, use the down arrows to filter by User, Admin, Building, Department, Grade, Group and/or Position Type. You must select at least one of the following: Eval Type(s), Component(s), Form(s) prior to selecting the desired Rubric(s).
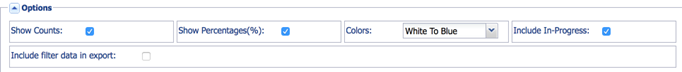
Options
From the Options section, choose any or all of the following:
- Show Counts: Displays, in "x out of y" format, the frequency with which the cell/descriptor was selected out of the total number of occurrences possible.
- Show Percentages: Displays, in percentage format, the frequency with which the cell/descriptor was selected out of the total number of occurrences possible.
- Show Values in Color: Offers a number of choices for depicting frequency using colors.
- Include "In-Progress": Includes data from any forms that have been initiated, but not Submitted. (Note: If you finalize a form without submitting it you need to check “Include In Progress” in order for data from the form(s)to be included in the report.)
- Include filter data in export: Displays the selected filter criteria on the exported report (PDF or Excel).
Run Report
- Click "View" to see the report on your screen.
- Below the report, click "Details" to display detailed data in a spreadsheet format that can be exported to Excel (details include First/Last Name, Rubric, Criteria, Selected Level, Building, Department, Grade, and Group),
- View PDF to create a PDF version of the report, or
- Export to Excel to create a spreadsheet of the data.
- Click "Save Configuration" in order to save your report for later use. The "Save Dates" option locks the dates in place that you selected for the report. So, if you wanted to save a report that showed a particular year’s data, you would use that option. If you want the report to automatically go to the current year every time you run it, you would not choose that option.
