support for users with a high level of
administrative rights
Growth Explorer Report Tool
Purpose: One of many types of reporting tools that are available to enable the easy creation of virtually any kind of report to support efficient process implementation and analysis and interpretation of data. (Other tools include Rubric Explorer and System Reports.)
The Growth Explorer displays data that is collected through single or multiple response items (e.g., drop-down lists, checkboxes, etc.) by representing the information in a graphical format (a one-dimensional heat map), which portrays the frequency with which each response was selected across users, buildings, departments, or the district as a whole. The user can specify a date to see a snapshot or indicate a timeframe to see progress and growth over time for a particular item.
To Access follow the path: Evaluation > REPORT TOOLS > Growth Explorer
Interface:
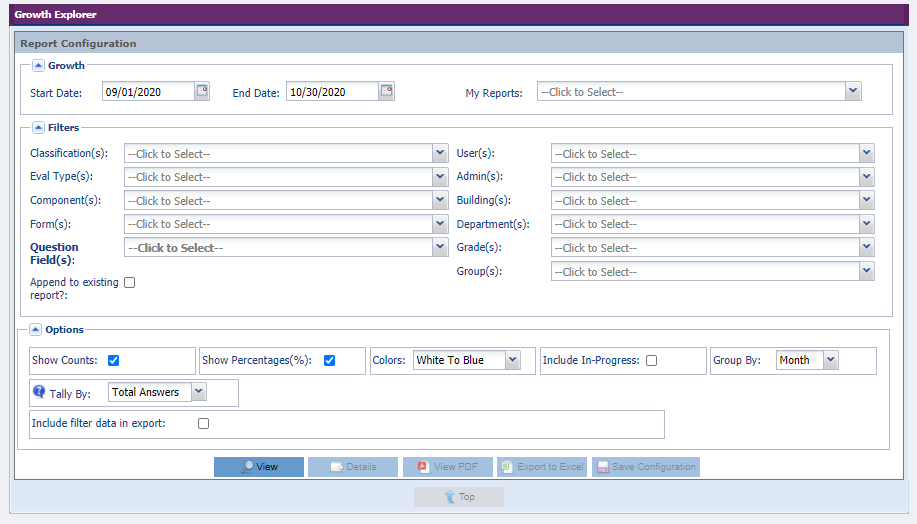
Growth
In the "Growth" section of the Report Configuration, use the calendar fields to select the Start and End Date parameters for the report.
Filters
From the left side of the "Filters" section, use the drop-down menus to select the desired Evaluation Types, Components, Forms as well as the questions from which you would like the report to pull data.
Use the down arrows on the right to filter by User, Building, Department, Grade, Group and/or Position Type.
Options
From the "Options" section, choose any or all of the following:
- Show Counts: Displays, in "x out of y" format, the frequency with which a particular response was selected out of the total number of occurrences possible.
- Show Percentages: Displays, in percentage format, the frequency with which the response was selected out of the total number of occurrences possible.
- Colors: Offers a number of choices for depicting frequency using colors. Include "In-Progress": Includes data from any forms that have been initiated, but not completed and Submitted.
- Group By: Indicates how the data will be displayed over time.
- Tally By:
- Total Answers: The number of times an answer was selected relative to the total number of answers submitted for the question. This is relevant for multi-answer questions such as checkbox sections.
- Total Forms: The number of times an answer was selected relative to the total number of forms submitted.
- Include filter data in export: Displays the selected filter criteria on the exported report (PDF or Excel)
Run Report
Click "View" to see the report on your screen.