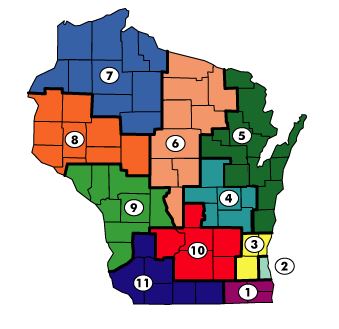
By partnering with the Wisconsin Department of Workforce Development, you can now access Industry Projection Reports for each of the 11 workforce development areas. Tabs in each report represent the labor market projections by career cluster. To learn more about the boards, go to DWD's page about Wisconsin's Workforce Development Boards. To see how this map compares to DPI's Regional Career Pathway map, go to the Regions page of Pathways Wisconsin.
Industry Projection Reports, 2020-2030
1. Southeastern Wisconsin Area
3. WOW Area
5. Bay Area
Information That Makes Industry Projection Reports Easy to Read
How do career clusters align with CTE program areas?
To see which career clusters align with CTE program areas, use this chart.
How do I know which workforce development area I am in?
You can find out which workforce development area you are in based on your zip code using this search feature.
What labor market information is provided in the industry projection reports?
Hot Jobs - jobs identified using the following criteria:
- Occupations must have an average annual wage above the state median;
- The percentage change must be greater than the state average; and
- The number of job openings projected must be greater than the state average.
Employment change, number - The numerical change in employment measures the projected number of job gains or losses.
Employment change, percent - The percent change in employment measures the projected rate of change of employment in an occupation. A rapidly growing occupation may indicate favorable prospects for employment. However, even modest employment growth in a large occupation can result in many more job openings due to growth than openings resulting from rapid employment growth in a small occupation.
High growth - High growth occupations are based on percentage change and must have at least 500 job openings over the latest long-term projections period to make the list. The larger the percentage change, the faster the occupation is growing.
Total annual openings - A combination of both new jobs and replacement jobs. Replacement jobs reflect people who are retiring or moving to a different occupation.
Annual median wages - the wage "in the middle." That is, half of the workers earned below this level. Often considered a more accurate reflection than “average wages” that can be misleading with extreme high or low numbers.