Overview
Below you will find a curated collection of web mapping applications and dashboards that foster exploration of school, district, library, and/or community data in Wisconsin.
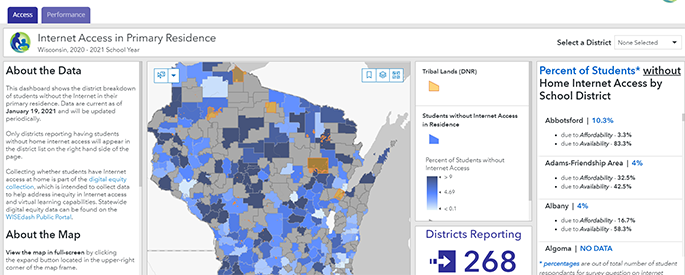
Wisconsin Digital Equity - Home Internet Survey
DPI is helping school districts collect and use their data on broadband speed and availability to better target initiatives to help get access to those who need it. This web application contains two map dashboards that display current school district-level survey results of the home internet access survey taken by Wisconsin students.
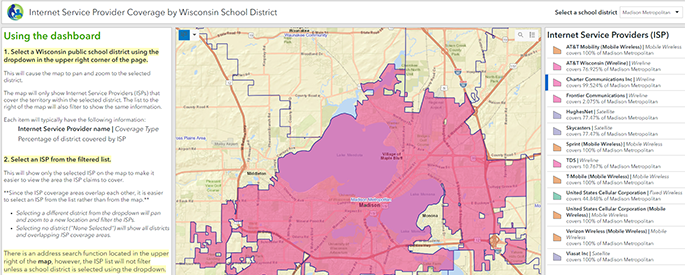
Internet Service Provider Coverage by Wisconsin School District
Determine which Internet Service Providers (ISPs) have coverage within a school district's boundary.
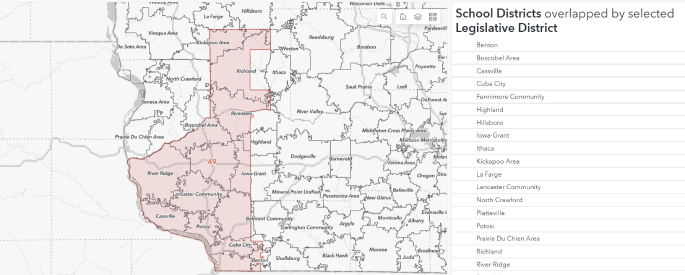
Overlapping School and Legislative Districts
This is a set of map dashboards that allows users to determine which school districts and legislative districts overlap each other. In the first dashboard, users can select a legislative district type – either US Congressional, Wisconsin State Senate, or Wisconsin State Assembly – and a district number to get a count and an alphabetized list of school districts that are overlapped by the selected legislative district. It’ll also display the current representative for the selected legislative district. The second dashboard allows users to select a school district to retrieve the legislative districts that overlap it and the current representatives of those districts.
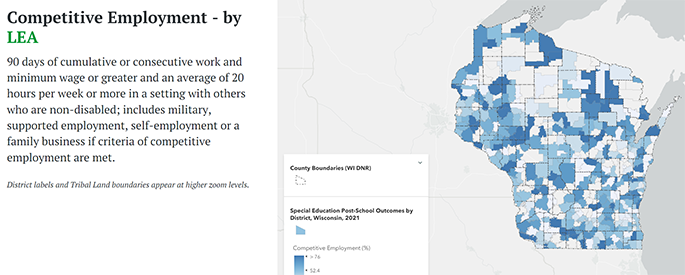
Indicator 14 - Post School Outcomes - 2022-2023 School Year
This web application contains a series of maps showing the major outcomes of the 2022 Wisconsin Statewide Indicator 14 Survey. The survey focuses on youth with disabilities who exited high school with a diploma, a certificate of attendance, reached maximum age of eligibility for services, or dropped out of high school during the 2020-2021 school year and have been out of school for one year.
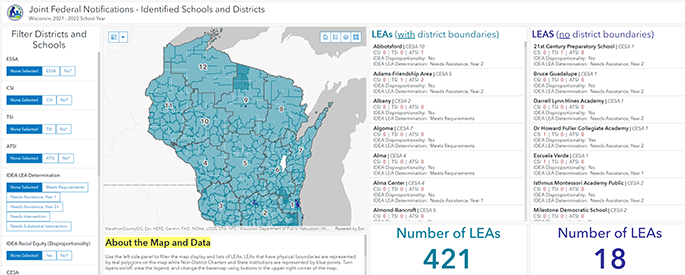
Joint Federal Notifications - Identified LEAs - 2023-2024 School Year
DPI issues joint accountability reports to all local education agencies under the two major federal education laws: the Every Student Succeeds Act (ESSA) and the Individuals with Disabilities Education Act (IDEA). DPI issues these two accountability reports jointly to help local education agencies (LEAs) inform and make continuous improvement efforts more streamlined across a district. This site contains two dashboards: one with ESSA and/or IDEA-identified LEAs and another displaying a series of maps showing the number of students impacted by those identifications.
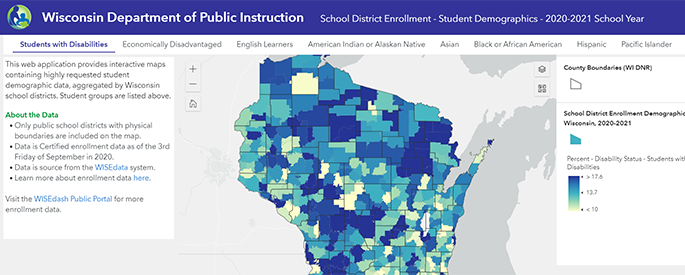
School District Enrollment - Student Demographics - 2023-2024 School Year
View student demographic data taken from the most recent school year's school district enrollment.
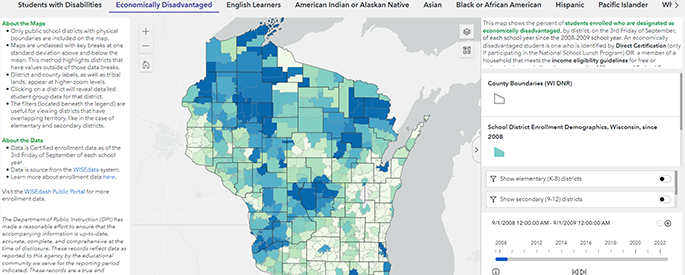
Time Series School District Enrollment 2008-2009 through 2023-2024
Explore a time-series map containing school district enrollment by student group since the 2008-2009 school year.
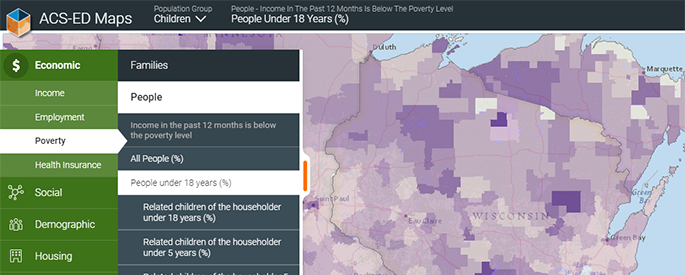
ACS-ED Maps
Explore community data using a tool that gives geographic context to social, economic and education conditions. The National Center for Education Statistics (NCES) has developed a tool that identifies conditions of school-age children in school districts based on data from the U.S. Census Bureau’s American Community Survey Education Tabulation (ACS-ED).