WISEdata Portal Home Screen: Data Pipeline Status Overview

This mini-tutorial will provide a ‘top-to-bottom’ tutorial for the WISEdata Portal, Agency Tab, Home screen.
It will cover all of the features presented on the Home screen, and provide insights for when, and how customers can get the most impact from these features.
The Home screen displays an overview of your data flow status, as your data flows through the "data pipeline" from your LEA’s student information system (SIS) into WISEdata Portal. You will see statistics about whether or not data made it out of your SIS to the Ed-Fi API and from there into the WISEdata Portal.
Click the links below to navigate to different sections of this page:
Alerts
At the very top you may see an orange banner, alerting users of:
- System alerts
- Unacknowledged data alerts
- Other alerts

Clicking the blue “Learn More” button will bring you to the Alerts screen. Read the WISEdata Portal Alerts Mini Tutorial for more details.
WISEdata API Transactions (a.k.a. The Data Pipeline)
When flowing correctly, the data you enter into your SIS is submitted to WISEdata for state reporting to DPI.
You will want to ensure it is transmitted successfully. Best practice is to build a habit of regularly checking the Data Pipeline Status first before navigating to the other tools in WISEdata Portal. This makes you aware of any data flow issues.
If the data in your SIS is not flowing to WISEdata Portal, the work you do to push over accurate data from your SIS will not be successful if data is not properly flowing.
There are graphics on the Home screen in WDP to help you know if this is happening. Just below the Alerts (if any are displayed) is the WISEdata API Transactions section of the Home screen. This section gives a quick visual of the connectivity and communication between your SIS vendor tool and WISEdata Portal.
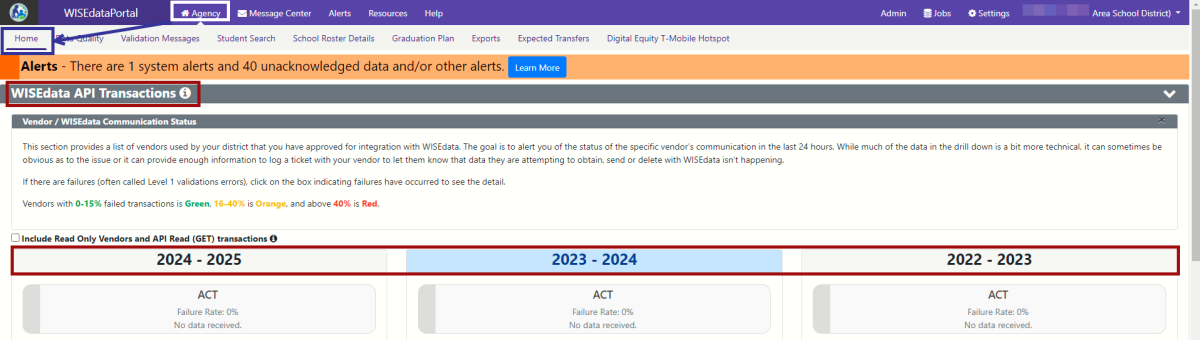
This section provides a list of vendors used by your district that you have approved for integration with WISEdata. The goal is to alert you of the status of the specific vendor’s communication in the last 24 hours. While much of the data in the drill down is a bit more technical, it can sometimes be obvious as to the issue or it can provide enough information to log a ticket with your vendor to let them know that data they are attempting to obtain, send or delete with WISEdata isn’t happening.
If there are failures (often called Level 1 validations errors, and also referred to as the "Failure Rate"), click on the box indicating failures have occurred to see the detail. If the colors displaying are not green, you should contact your Student Information System (SIS) vendor representatives.
Three columns provide information for each vendor your LEA uses for the three years worth of data stored within WISEdata Portal. Each vendor is displayed on a tile. Hovering over the tile causes an information bubble to appear. Clicking on the tile opens a new tab in your browser, displaying API transaction data.
Vendors with 0-15% failed transactions display in Green, 16-40% display in Orange, and above 40% display in Red.
The red and orange indicators mean that there are errors preventing some/all of the data from flowing as expected through the Ed-Fi API. This lack of data flow between your SIS vendor tool and the Ed-Fi API is an “L1” error.
However, unless you are actively troubleshooting a data flow issue it is not necessary to prioritize L1 errors. If no data flow issues exist, it is a better use of time to concentrate on L2 errors.
If you are actively troubleshooting a data flow issue, then L1 errors can be extremely helpful, and you should provide this information to your SIS vendor support representatives.
There are L1 errors issued from the Ed-Fi API that may prevent your data from transmitting. Some examples of this API data prevention could be:
- you're no longer the primary enrollment-holding school or
- a crucial program record is missing when trying to send a crucial data record (e.g., overlapping enrollments, program data, etc.).
It's possible there are also other issues with your SIS preventing proper submission, so it's important to keep an eye on this step. This connection must be fixed by communicating with your SIS vendor tool support staff. DPI cannot provide support for SIS vendor tools.
Hovering over the checkmark will display an information message: “One or more transactions in the last 24 hours submitted by ‘Vendor Name’ for the ‘current school year’ are in error.”
To troubleshoot which L1 errors occurred, click the red “x” on the tile you want to drill into. This will open up a new browser tab for the WISEdata Portal Home screen.
This new screen will display the name of the vendor tool you selected for the year you selected. A table will display a list of up to 100 L1 errors.
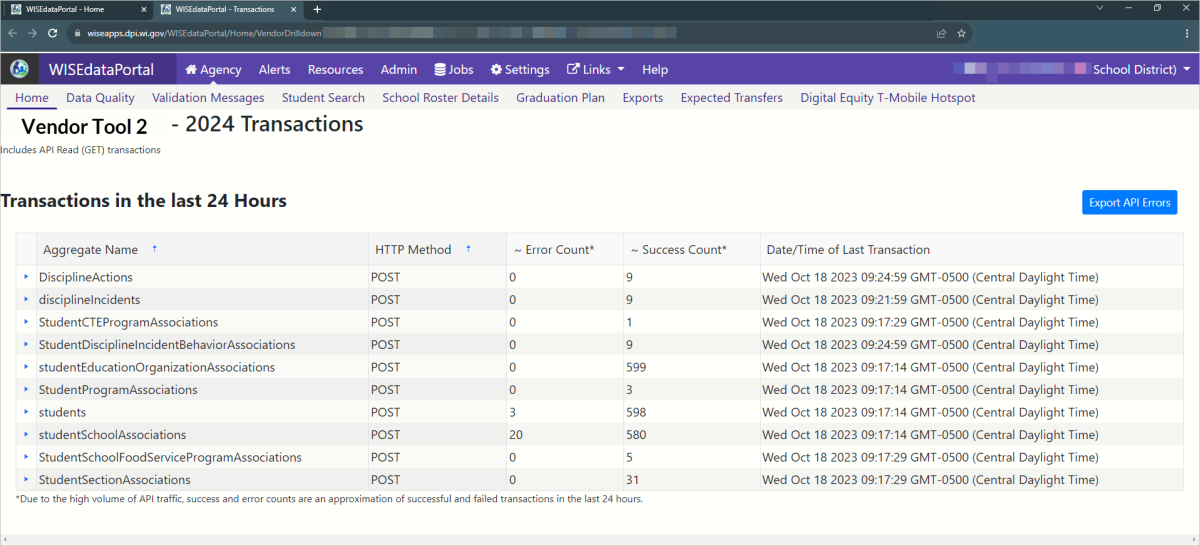
Transactions will display sorted by Aggregate Name, such as Student Program Association.
You will also see the HTTP Method, such as POST (add data) or PUT (update data), which explains how your SIS was interacting with the API. In addition you will see the error and success counts with a timestamp for when the last transaction was processed.
The table also reveals error counts and success counts.
-
Error Count: If you see 0 in some areas in this column, this is good, as it indicates zero errors. However, a word of caution that a lack of errors does not prove connectivity between your vended application to the Ed-Fi API. Successful connectivity can only be affirmed by one’s Success Counts. The topics with errors will provide insights for why you are not seeing data flow in unique situations.
-
When the Error Count is not zero, and you need to troubleshoot a known issue, please do this by contacting your SIS vendor tool support persons. The DPI Customer Services team cannot troubleshoot or problem solve SIS vendor data flow issues.
-
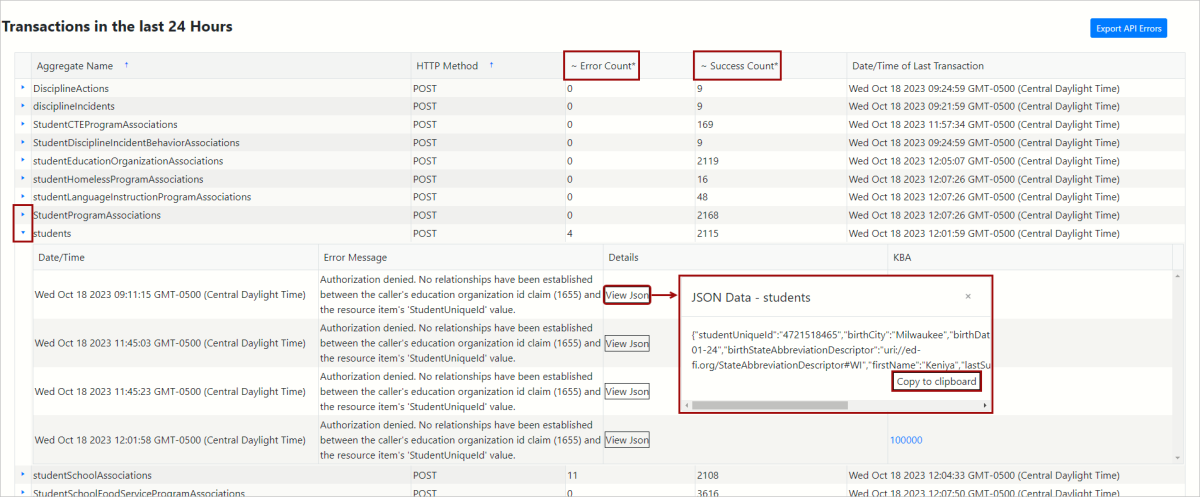
With the support of your SIS vendor tool support representative, you can find additional details by clicking the expander tool from the far left column (blue, rotating triangle) for a detailed view. You can even view the nitty-gritty technical information by clicking the ‘View JSON’ button. It may be very helpful to copy the JSON text and hand it off to your IT person or SIS vendor support when technical assistance is needed.
-
-
-
Success Count: Seeing 1 ‘Success Count’ is an indicator that the connection between your SIS vendor tool and the Ed-Fi API exists. If you see all zeros in all areas under this column, this indicates ‘Zero success' which is a problem. Zero success count means there is an issue with data flow, specifically your data is not flowing through the Ed-Fi API. Since data flows from your vendor application, to resolve the issue start by reaching out to your vendor.
There are L1 errors issued from the Ed-Fi API that may prevent your data from transmitting. Some examples of this API data prevention could be:
- you're no longer the primary enrollment-holding school or
- a crucial program record is missing when trying to send a crucial data record (e.g., overlapping enrollments, program data, etc.).
It's possible there are also other issues with your SIS preventing proper submission, so it's important to keep an eye on this step. This connection must be fixed by communicating with your SIS vendor tool support staff. DPI cannot provide support for SIS vendor tools.
Include API Read (GET) Transactions
You will notice a checkbox in the Vendor(s) section, Include API Read (GET) transactions, located below the information box/at the top of your listed vendor tool tiles. If you need a refresher on what Ed-Fi is, please check out the Ed-Fi Credential Application Mini-Tutorial.
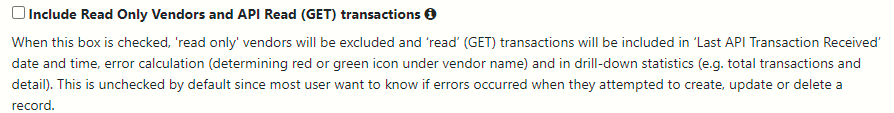
When you check this box (checkbox turns blue), instead of seeing “No data received” within the tile under the vendor tool name, you will see a date/time stamp. This date/time stamp tells you the last time a transaction occurred between the vendor tool and the Ed-Fi API Credential application. This is unchecked by default since most users want to know if errors occurred when they attempted to create, update or delete a record.
WISEdata Status Section
Data Out of Sync
Scrolling down, you will see another section to the Home screen. This section shows whether or not the data in the API and in the WISEdata Portal is in sync.
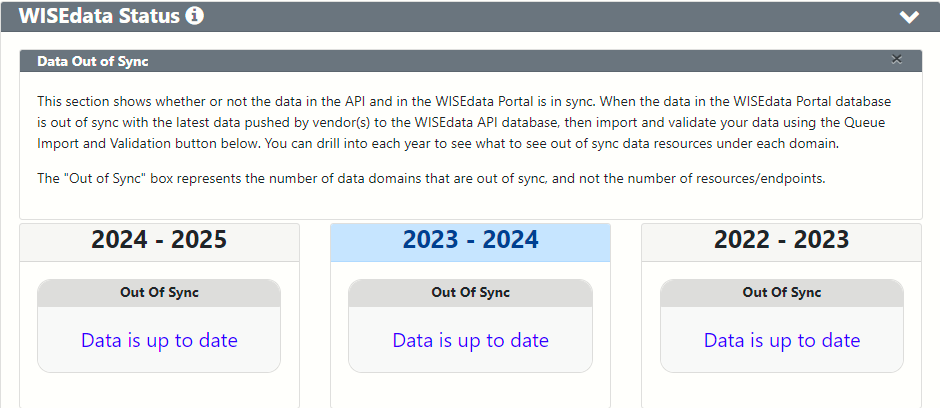
When the data in the WISEdata Portal database is out of sync with the latest data pushed by vendor(s) to the WISEdata API database, then import and validate your data using the Queue Import and Validation button. (The Queue Import and Validation button is just below on the Home screen.)
You can drill into each year by clicking on the tile for that year. A pop-up window will display what to see out of sync data resources under each domain.
The "Out of Sync" box represents the number of data domains that are out of sync, and not the number of resources/endpoints.
Queue Import and Validation
The second part of the WISEdata Status section shows whether or not the data in the API and in the WISEdata Portal are in sync. This section allows you to trigger validation manually instead of waiting for the nightly validation cycle.
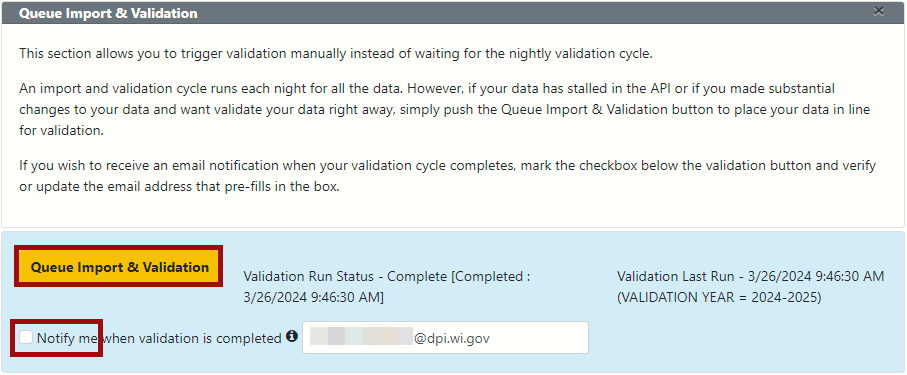
Queue Import and Validation
An import and validation cycle runs each night for all the data. However, you can trigger validation manually if:
- your data has stalled in the API, or
- substantial changes were made to your data and you want to validate right away instead of waiting for the nightly validation cycle.
Simply push Queue Import & Validation to place your data in line for validation.
- The length of time for validation will vary based on how many districts are in line in front of you.
- If you try to queue validation when it's already running, you will see a pop up box to alert you that the import is in progress.
Request Notification When Queuing Validation
If you wish to receive an email notification when your validation cycle completes, mark the checkbox below the validation button and verify or update the email address that pre-fills in the box.
The email will only send for this validation, not all validations and not for system-wide validation jobs that run each night. You must mark the checkbox prior to pushing Queue Import & Validation.