Navigating the WISEdash Public Portal
We have implemented a simplified layout for the WISEdash Public Portal that will make finding the right dashboard more intuitive. This dashboard offers an user-friendly design and a full menu of dashboard options. Student information in WISEdash Public Portal data is redacted, revealing no personally identifiable information.
Click the links below to navigate to different sections of this page:
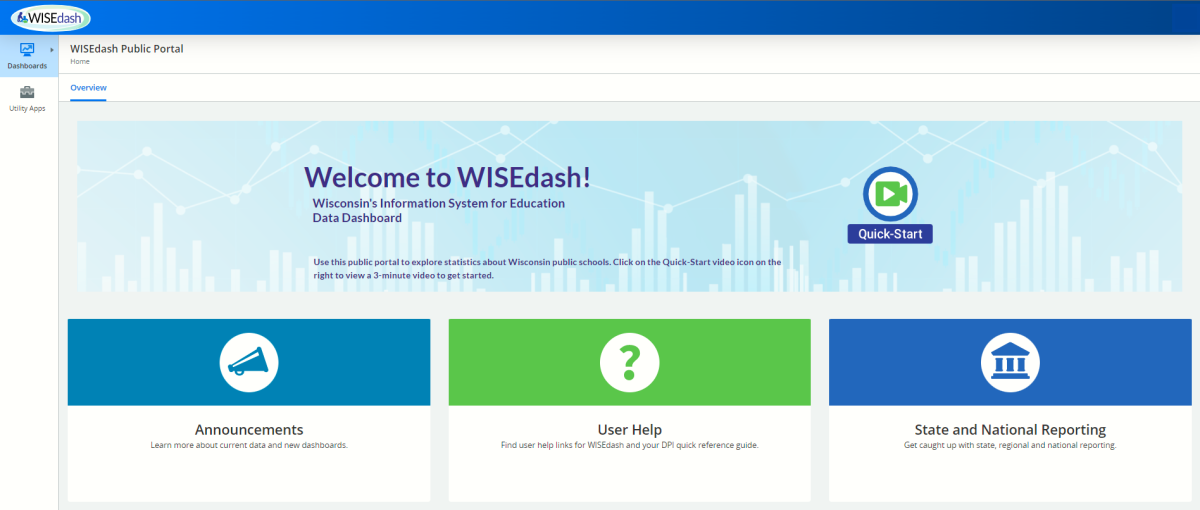
How Do I get started with WISEdash Public Portal?
The WISEdash Public Portal Overview screen displays: Announcements, User Help and State and National Reporting. Click the blocks to:
- Quickly access announcements about current data and new dashboards.
- Find links for WISEdash support and quick reference guides.
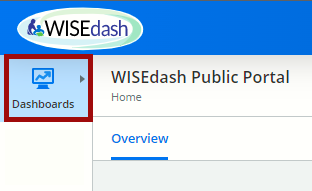
Where Do I Find the Dashboard I am Looking For?
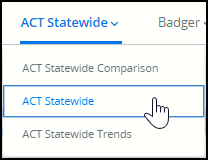
Once you select a dashboard to view (i.e., Student Engagement > Discipline), the other dashboards available within that grouping will appear horizontally across the top of the screen. The WISEdash Public Portal Dashboard menu is listed below:
- Home Dashboard
-
Home Dashboard Submenu:
- Overview
- Digital Equity Dashboard
-
Digital Equity Dashboard Submenu:
- Digital Equity
- ESSA Dashboard
-
ESSA Dashboard Submenu:
- ESSA Overview
- Finance Resources
- Student Engagement Dashboard
-
Student Engagement Dashboard Submenu:
- Attendance-Dropouts
- Discipline
- Enrollment
- Enrollment – Private School
- Special Ed Indicators
- Oct 1 Child Count
- State Tests Dashboard
-
State Tests Dashboard Submenu:
- Overview
- ACT Aspire
- ACT Statewide
- Badger
- Forward
- PreACT Secure
- Choice School Results (DPI web)
- Coursework Dashboard
-
Coursework Dashboard Submenu:
- Career Technical Education
- Graduation Dashboard
-
Graduation Dashboard Submenu:
- Graduation Overview
- ACT Graduates
- AP Exams
- HS Completion
- Postsecondary
- Postgrad Plans (DPI Web)
- School Staff Info
-
School Staff Information options:
- School Course Info
-
School Course Information options:
- School Finance Info
-
School Finance Information options:
- Comparative Cost and Revenue (DPI Web)
- School Finance Data Warehouse (DPI Web)
- School Finance Data Maps (DPI Web)
- Per Pupil Expenditures Dashboard
- Help
Why Do Some Links take Me to a DPI Webpage?
DPI has a wide variety of web resources, and we want to make you, the people we serve, aware of them!
Any items listed on WISEdash Public Portal that will take you ‘out’ of the dashboard to a DPI webpage will be indicated with the tag (DPI Web), and it will open another tab in your browser, displaying that DPI website.
Your WISEdash Public Portal tab will not close.
How Do I Filter Information on the Dashboard?
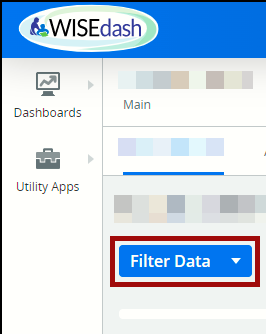
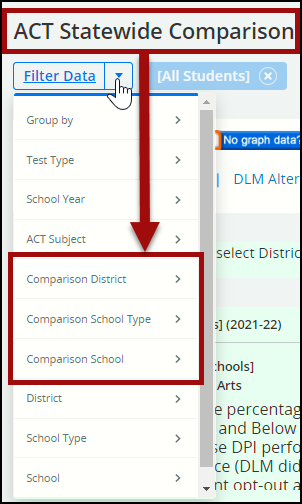
The “Filter Data” button appears on every dashboard on WISEdash Public Portal.
However, different dashboards offer different available filters. For example:
- only the comparison dashboards offer the comparison filters.
- the only available filter when viewing the Digital Equity dashboard is school year, since this data is displayed at a Statewide level.
Once you have selected the filters you want to use by clicking the radio button (blue means it is selected), simply click anywhere on the screen outside the filter list to apply those filters.
What Are the Icons on the Top of the Dashboards?
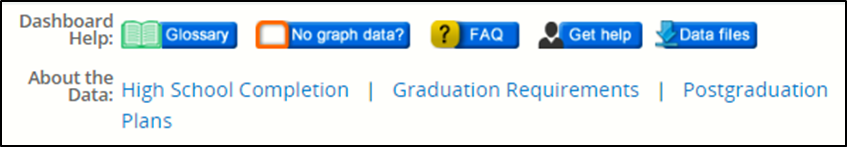
The Help Toolbar above each dashboard provides useful information to explore the data meaningfully. Every button is self explanatory. The "About the Data" hyperlinks will open a new browser tab to a trusted DPI web page that provides detailed guidance about the data dashboard you are viewing.
What Is the Difference Between Primary, Comparison and Trend Dashboards?
The primary dashboard (of any topic) will display the most recent, certified data as a default, but other years can be selected. The summary dashboard defaults to Statewide data, but you can use the ‘Filter Data” button to select a district or a school.
The trends dashboards display data as line graphs covering a five-year span.
The comparison dashboard allows you to select and apply various filters so that you can compare results from one group of students with another (District A and District B, District A and Statewide data, etc.).
Comparison dashboards appear in a side-by-side display, one on a blue background and the other on a yellow background. Both comparison graphs default to Statewide.
Comparison dashboards have comparison filters, which do not show up on other dashboards. The Comparison District/School Type/School filters will always apply to the graph on the yellow background.
Use the “Filter Data” button to select the filters you want to see applied to the graphs. Click outside the filter list to apply your selections.
How Do I View the Dashboard Bar Graph as a Table?
A limited number of dashboards on WISEdash Public are only viewable as tables. These include Graduation Requirements (located under the Graduation > High School (HS) Completion dashboard).
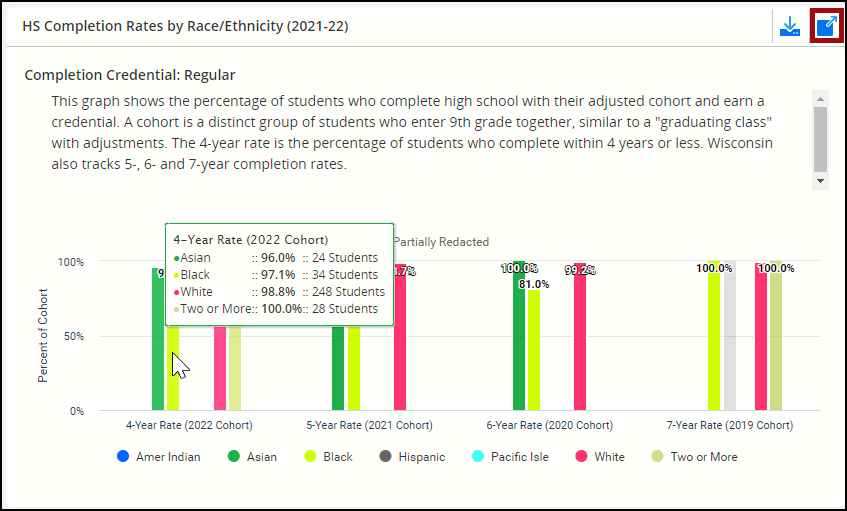
Most other dashboards display data in multi-colored bar graph. On any of these bar graphs or line graphs, you can hover your cursor over the bar or line and a small box will open displaying the numerical amounts that make up the percentage displayed on that bar or line. In the screenshot below, you can see that 24 students make up the dark green bar on the far left representing students of Asian race/ethnicity. These 24 students are 96% of the graduating class for that race/ethnicity group.
To view this data as a table, you must click the, “More info” icon in the upper right corner of that set of bar graphs. This will open a pop-up window that has two tabs:
- Content tab: displays the same bar graphs.
- Data tab: displays the information in a table.
Tables have limited filtering capability. Click the “X” in the upper right-hand corner or the blue “Close” button in the lower right corner to close this pop-up window.
How Do I Export WISEdash Public Portal Data?
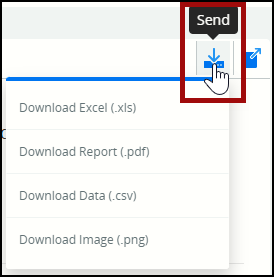
To export data from a dashboard, you must click the “Send” icon in the upper right-hand corner. When clicked, a dropdown menu will appear allowing you to select the type of file you want. There are three options for data downloads: .xls, .pdf, .csv, and one option to download the dashboard graphs as an image: .png.
Additionally, users can also visit the WISEdash Public Portal Statewide Data Files page, which allows you to download a wide variety of records.
How Do I Learn More About the Features on WISEdash Public Portal?

Visit the WISEdash Public Portal landing page, the WISEdash Public Portal FAQ page, and the WISEdash Public Portal: Help Pages and User Guides page, which also has the WISEdash Public Portal 3- Minute Quick Start Video.
The WISEdash Public Portal: Help Pages and User Guides page has a wide selection of additional support pages located in the left side menu. These additional support pages are listed alphabetically and provide many unique topics of support.
Return to WISEdash Public Portal: Help Pages and User Guides page