How-To: Navigate the Special Education Student Profile in WISEdash for Districts

Click the links below to navigate to different sections of this page:
Purpose of Viewing/Using Student Profile Data
The SpEd Student Profile may be used to view individual special education student data, such as disability status, last evaluation date, educational environment, disability, reason exited, and whether or not the student is a Parentally Placed Private (PPP) student.
Terminology
The following icons are used throughout WISEdash for Districts:
| ICON | DESCRIPTION |
|---|---|
| Dashboards Menu (upper left screen). Dashboard menu items appear on the left. Each Dashboard menu item has a corresponding sub-menu that appears on the right. Sub-menus are dynamic, changing with the selected dashboard. | |
| Utility Apps (upper left screen, below dashboards icon) | |
| Dashboard Tools (mid-right screen in darker gray area) |
Step-by-Step Instructions - Overview
There is more than one way to navigate to a special education student profile in WISEdash for Districts. These webpages linked below provide general steps for each method.
NOTE: Only WISEdash users with specific roles have access to student level detail.
Method 1: Student Profile
Follow the steps on the WISEdash How-To: Student Profile webpage.
Method 2: Snapshot Data
Follow the steps on the WISEdash How-To: Locate Snapshot Data webpage.
Once You Have Opened a Student Profile Dashboard
Use the Headers below to navigate to different steps within this section:
- From the Student Profile Dashboard > Main Submenu > SPED Dropdown Option
- From the Student Profile Dashboard > Main Submenu > TFS/Oct 1 Child Count Dropdown Option
- From the Snapshots Submenu > Oct 1 Child Count Dropdown Option
-
Method 1: Student Profile Dashboard: From the Main Submenu > SPED Dropdown Option
-
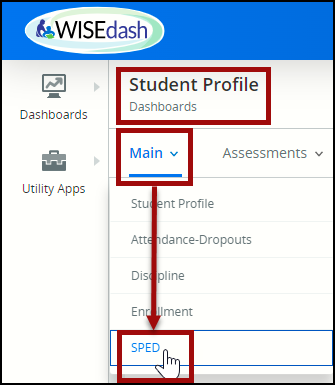 On the Student Profile dashboard screen (which should be open as a separate tab in your browser from the rest of WISEdash), click the dropdown for the Main submenu, then click SPED.
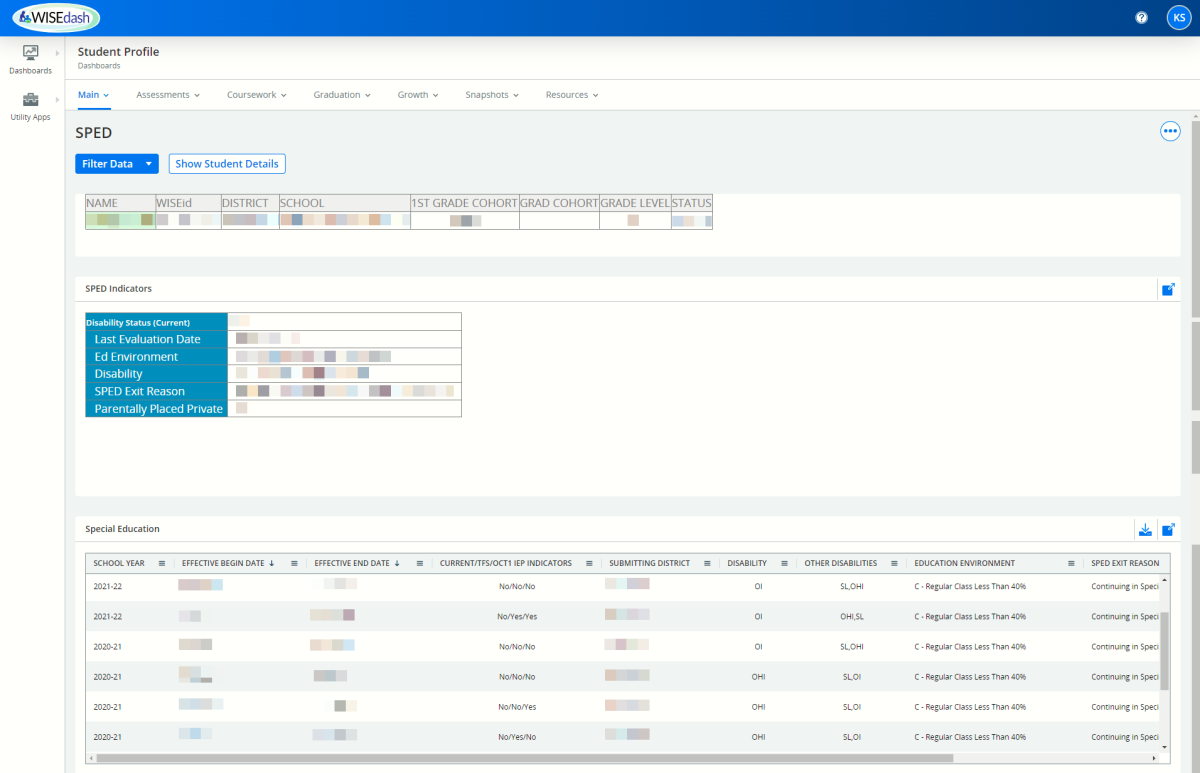
The Student Profile dashboard for SPED should display three main sections:
A table (2 rows, 8 columns), identifying the selected student with name, WISEid, District, School, 1st grade Cohort, Grad Cohort, Grade Level and Status.
A table (6 rows, 2 columns) of SPED Indicators showing Current Disability Status, Last Evaluation Date, Educational Environment, Disability, Reason Exited SpEd, and Parentally Placed Private indicator.
A dynamic (10 column) table with the following column values:
-
School Year
-
Effective Begin Date
-
Effective End Date
-
Current/TFS/Oct 1 IEP Indicators
- Submitting District
-
Disability
-
Other Disabilities
-
Education Environment
-
SPED Reason Exited
-
Parentally Placed Private
-
-
Method 2: Student Profile Dashboard: From the Snapshots Submenu > TFS Count Date/Oct 1 Child Count Dropdown Option
-
The Student Profile dashboard for TFS Count should display four main sections:
-
A table (2 rows, 8 columns), identifying the selected student with name, WISEid, District, School, 1st grade Cohort, Grad Cohort, Grade Level and Status.
- Demographics
- Enrollments
- Enrollment Indicators
- Special Education
NOTE: Even though the Submenu dropdown option is labeled TFS Count Date/Oct 1 Child Count, the Student Profile will only use “TFS Count” as the Header for that screen.
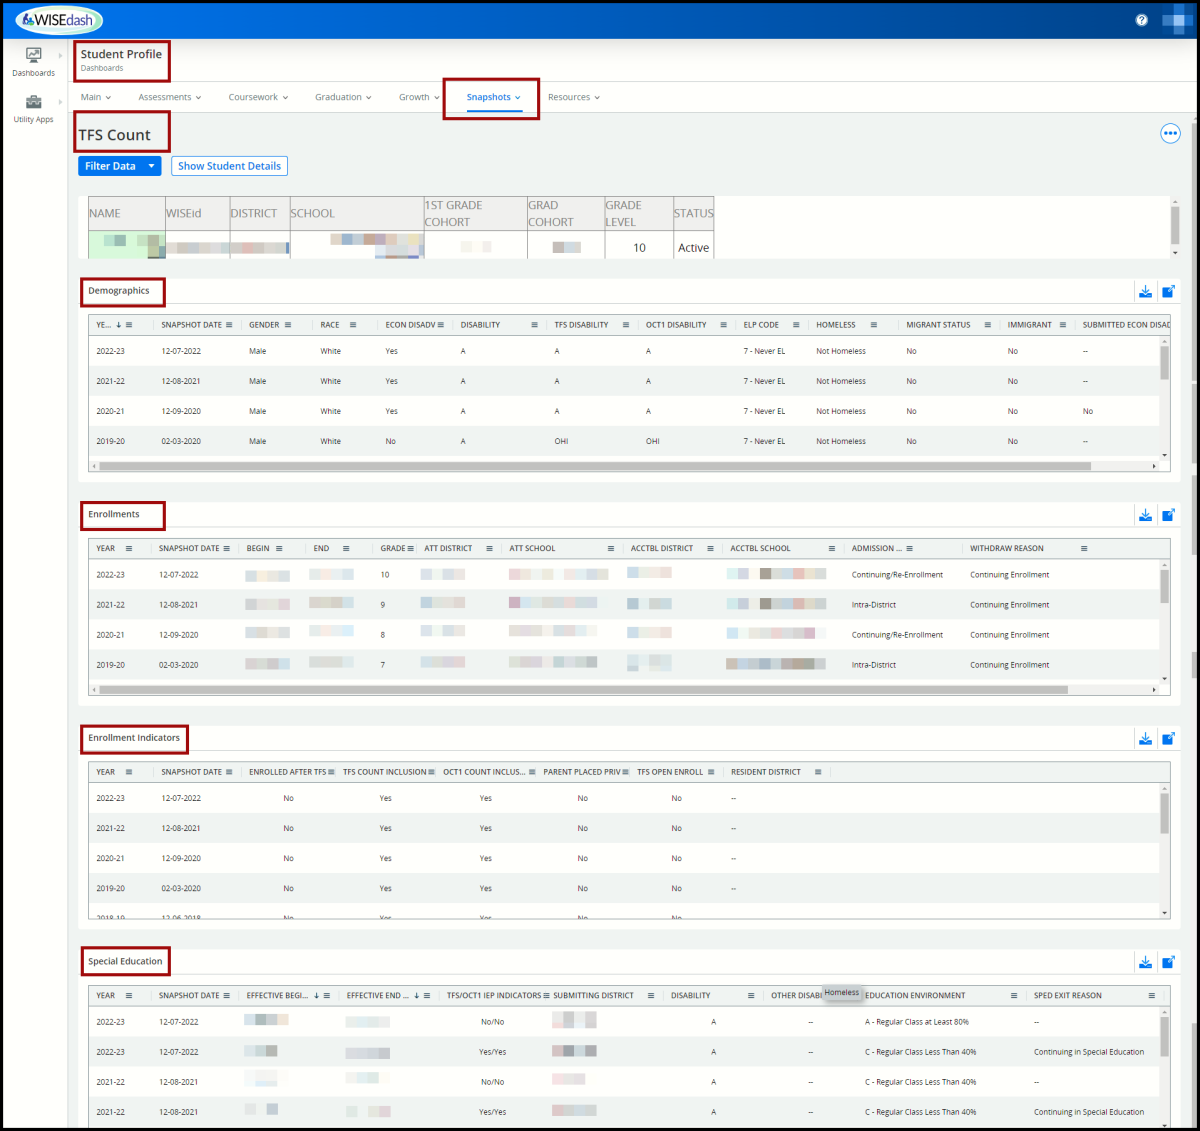
All data is displayed with the most current information as the first row in each table.
-
-
Method 3: Student Profile Dashboard: From Dashboards > Snapshot > Oct 1 Child Count
-
From the Oct 1 Child Count Snapshot click the number located in the “Count Inclusion Oct 1 = Yes” Data Quality Indicator.
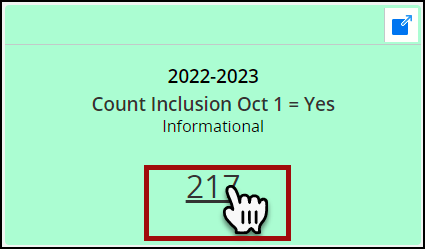
Clicking the number will change your view from the Data Quality Indicators and the Dynamic Crosstabs, to a table including all of the students included in that count date.
The table dynamic (14 column) table with the following column values will display:
Student Name
WISEid
Current Indicator
School Year
School Name
Metric Name
Usage
Enroll Date
Exit Date
PP Private (PPP)
Age Oct 1
To locate a specific student from the table, use the column values to adjust the viewing order. Each of the column values can be:
- clicked once to adjust the view to ascending order (indicated with an upward arrow),
- clicked twice to adjust the view to descending order (indicated with a downward arrow),
- and clicked a 3rd time to return to the default display order (no arrow).
Once you have found the row on the table of the student profile you wish to view, clicking on any underlined item in that row will open up the individual Student Profile Dashboard in a new tab in your browser.
More Help and Resources
- Snapshot Preparation: A Detailed Guide (Google slides)
- How-to Guides: A Google folder containing short presentations describing WISEdash navigation and features.
- WISEdash Info, Help and FAQ: Home page for WISEdash for Districts.
- WISEdash ATD: About the data pages for all WISEdash for Districts data topics.
- Data Privacy: Home page for DPI training around resources around student privacy.
- WISE Home: DPI landing page for the WISE system, contains intro video and basics about WISE.
-
Consider joining our WISE Community! A Microsoft Teams environment where you can read up on current topics and post questions.
-
Would you like to ask questions directly to a Customer Services Team member? We also host a recurring WISE User Group Webinar! Join us!
Didn't Find What You Needed?
We are here to help!
If the question you’ve been trying to answer isn’t showing up on our training or web materials, please open a Help Ticket.
Help Ticket for WISEdash - when the ticket is open, select WISEdash for Districts from the Applications drop-down menu.